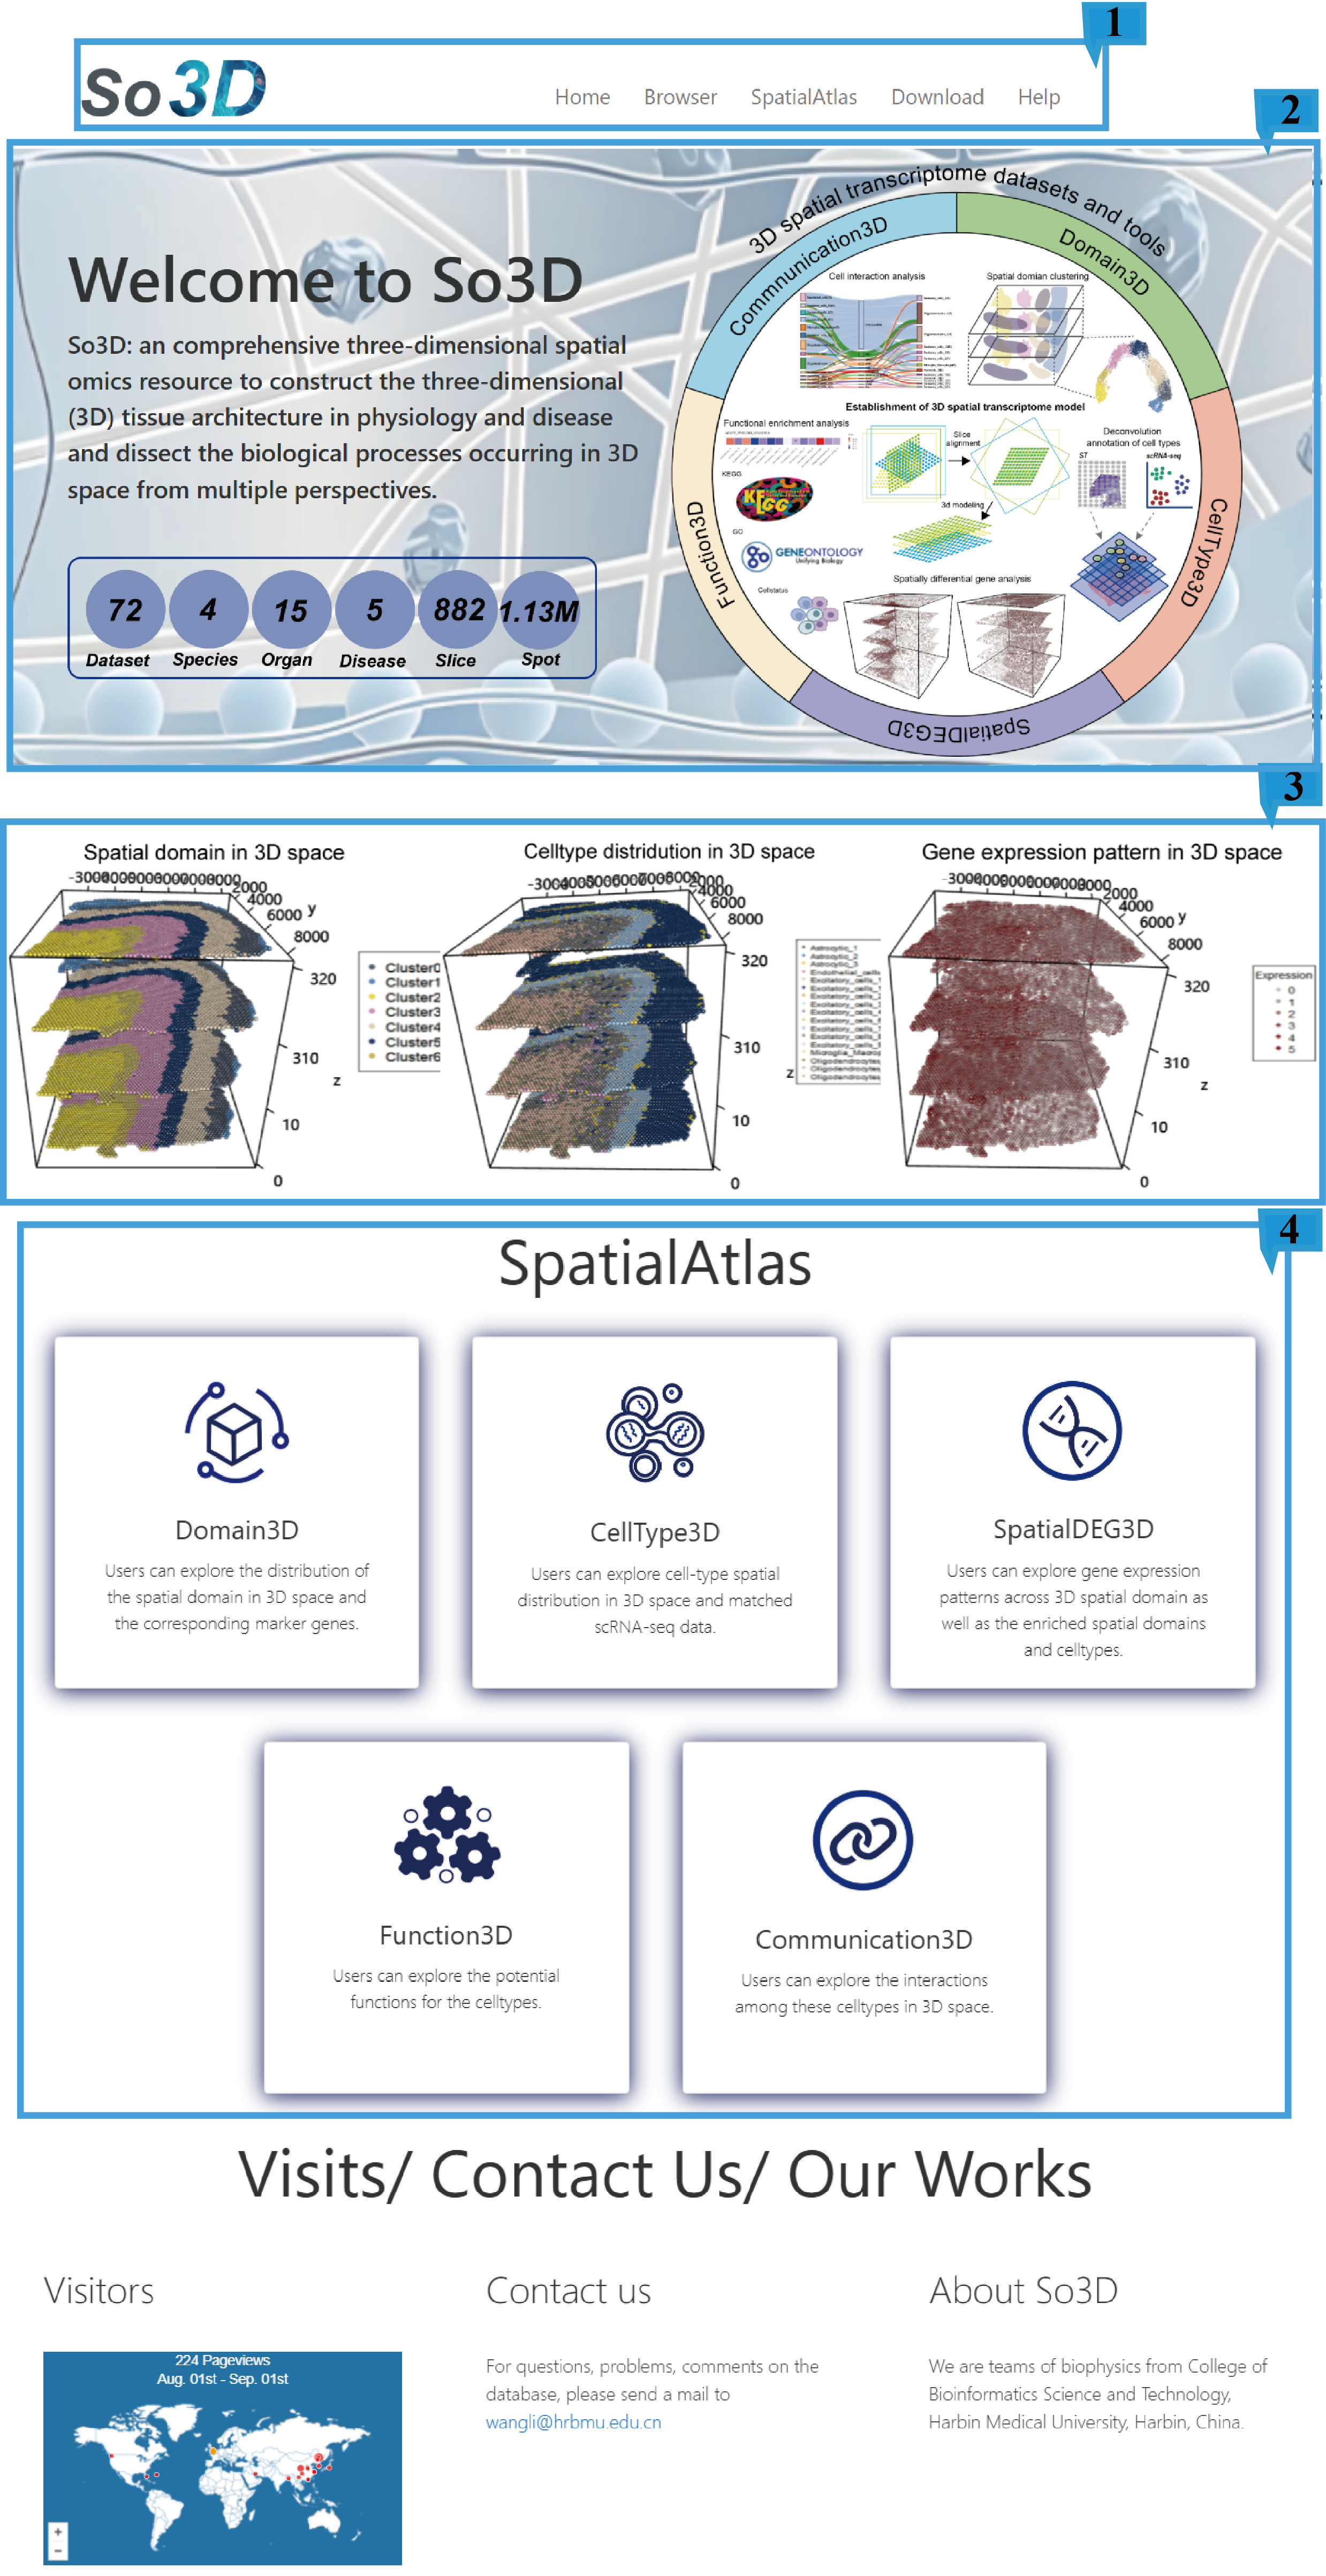
The home page contains tool entrance, schematic diagram and brief introduction to help users understand our database.
1.Main functions of the database are provided in menu bar form (boxed in blue).
2.The brief introduction of SO3D.
3.Interactive 3D Model Rotation.
4.Entries and visualization overviews of Domain3D, Celltype3D, Spatial3D, Function3D, and Communication3D.
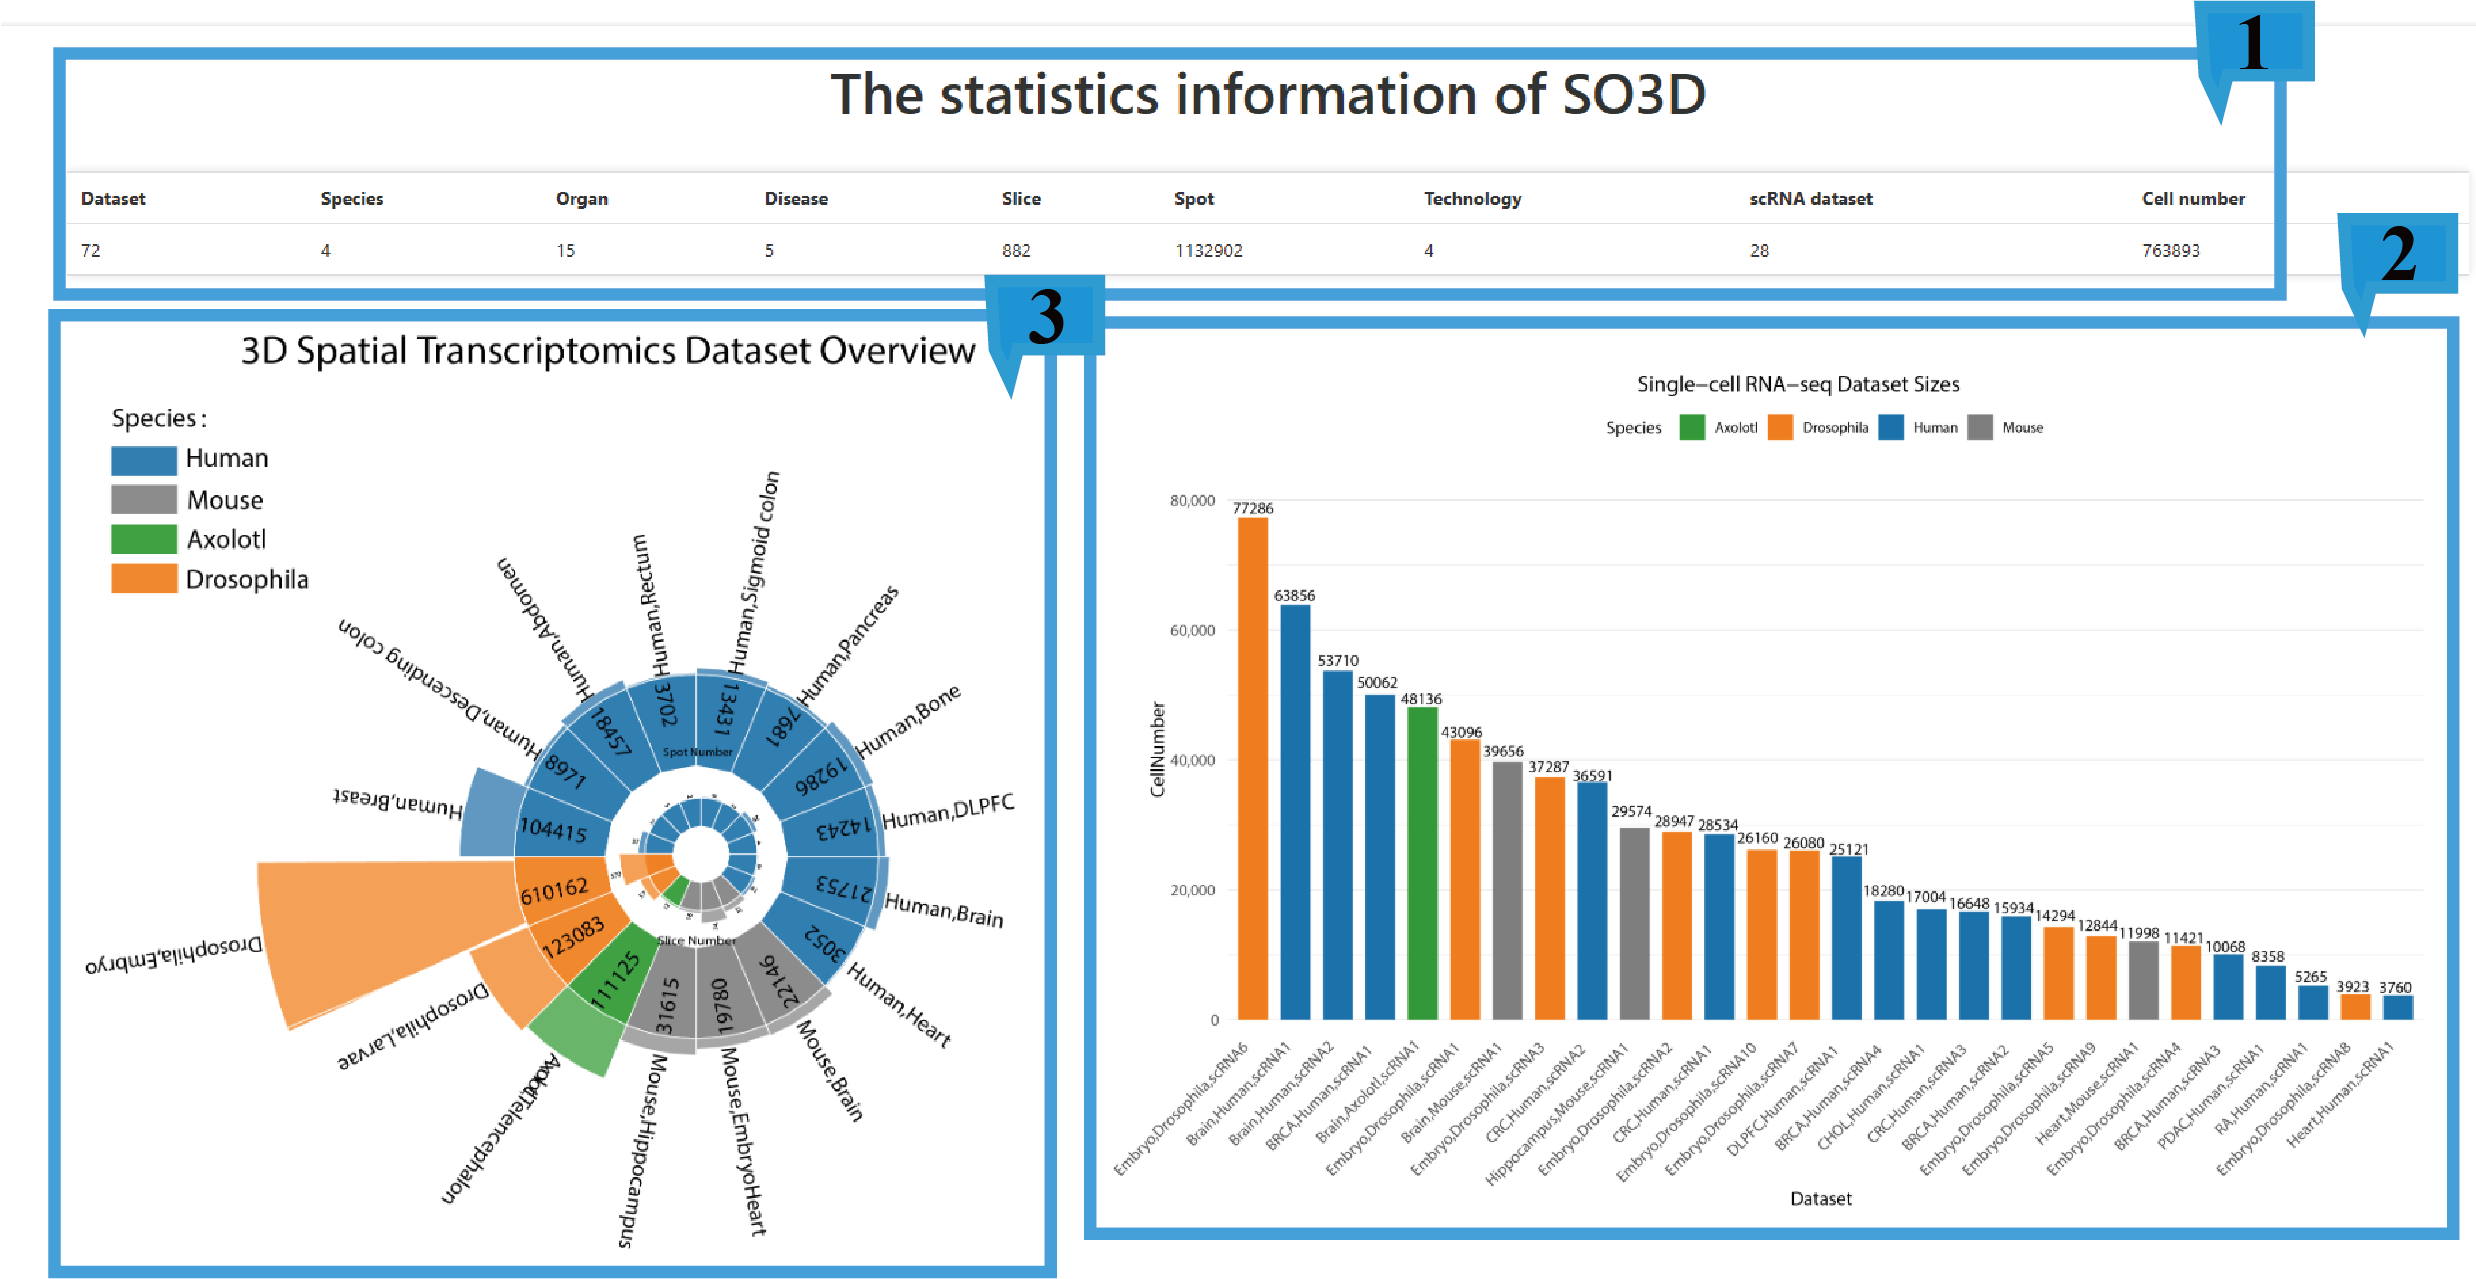
Firstly, the browse page provides an overview of the statistical information of the 3D spatial transcriptome datasets and related single-cell datasets in the database.
1.The table presents the datasets and their basic information stored in the database, including 3D spatial transcriptome dataset number, Species number, Organ number, Disease number, Slice number, Spot number, Spatial transcriptome sequencing technology number, single-cell dataset number, and the number of cells in single-cell datasets.
2.The circular chart shows the information of each 3D spatial transcriptome dataset, including species, dataset name, number of sites, and number of slices.
3. The histogram shows the species, dataset name, and number of cells of each single-cell dataset.
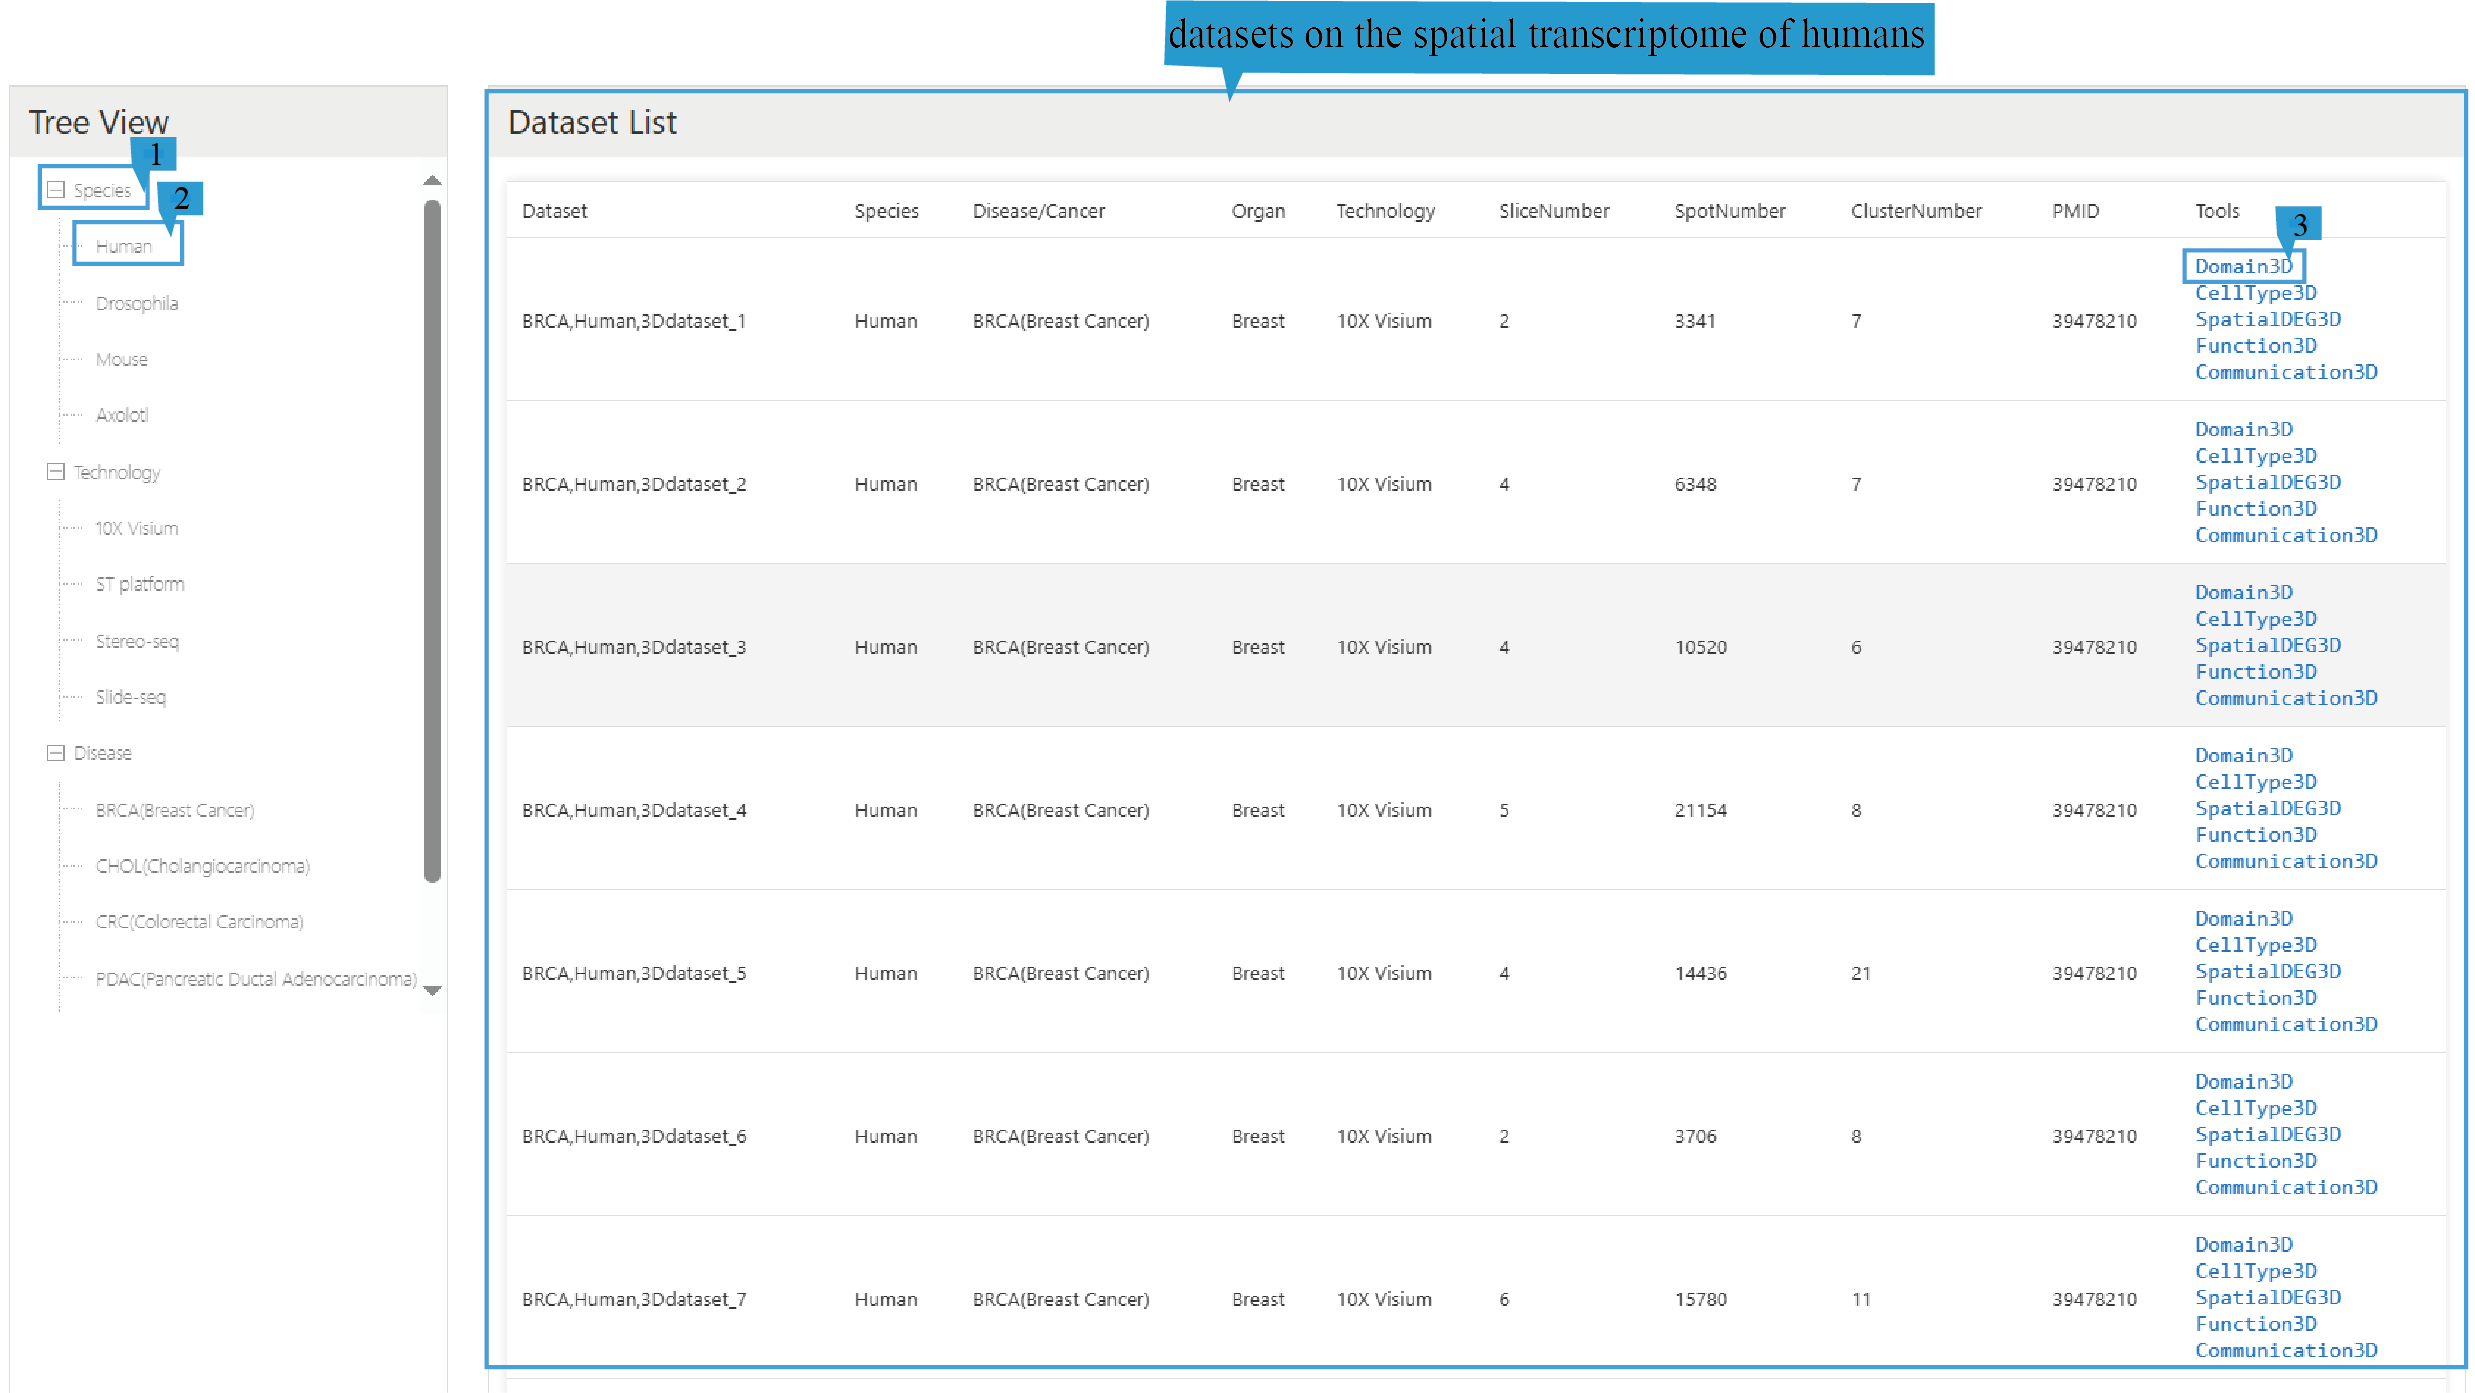
In addition, the browsing page is structured based on different species, sequencing technologies, diseases, and tissue stratification, and the relevant spatial transcriptome data information will be displayed in a tabular format. Click on the text can sort the list based on the content of that column.To browse 3D spatial transcriptome datasets related to a specific species (such as human), click "Species" (Step 1 in the figure below), and then select "Human" (Step 2 in the figure below). This will return 3D spatial transcriptome datasets related to humans. The results will be organized in a data table on the right side, with each row representing an associated record, including the dataset id, species, disease, organ, sequencing technology, number of slices, number of spots, number of clusters, and PMID. To browse the related analysis of spatial transcriptome datasets (such as human clustering analysis), click "Domain3D" (Step 3 in the figure below).
Dataset: The name of the 3D spatial transcriptome dataset.
Species: The species type corresponding to the 3D spatial transcriptome dataset.
Disease: The disease type of the samples in the 3D spatial transcriptome dataset.
Organ: The organ tissue from which the samples of the 3D spatial transcriptome dataset were taken.
Technology: The sequencing technology used in the 3D spatial transcriptome dataset.
SliceNumber: The number of slices included in the 3D spatial transcriptome dataset.
SpotNumber: The number of spatial transcriptomic spots contained in the 3D spatial transcriptome dataset.
Cluster:The number of spatial domains after clustering of the 3D spatial transcriptome dataset.
PMID: The PMID number of the article related to the 3D spatial transcriptome dataset.
Tools: Clickable links to access each analysis result of Domain3D, Celltype3D, SpatialDEG3D, Function3D, and Communication3D. The Domain3D link leads to the clustering analysis of spatial transcriptome, the Celltype3D link leads to the cell annotation analysis of spatial transcriptome, the SpatialDEG3D links to the gene expression analysis of differentially expressed genes in the spatial transcriptome in spatial transcriptome data and corresponding single-cell data, the Function3D link leads to the enrichment analysis of spatial transcriptome, and the Communication3D link leads to the cell communication analysis of spatial transcriptome.
This section contains five different analyses of the 3D spatial transcriptome dataset, namely Domain3D, Celltype3D, SpatialDEG3D, Function3D and Communication3D.
Domain3D: Perform cluster analysis on the 3D spatial transcriptome dataset, presenting the cluster analysis results and the distribution of spatial domains within the 3D model and each 2D slice in the form of tables, images, and 3D models.
Celltype3D: Perform cell annotation analysis on the 3D spatial transcriptome set, and present the cell annotation results and the distribution of different types of cells in the 3D model and each 2D section in the form of tables, images, and 3D models.
SpatialDEG3D: Analyze the differentially expressed genes in the 3D spatial transcriptome set, and present the expression of differentially expressed genes in 3D and 2D sections of the spatial transcriptome data in the form of tables, images, and 3D models, as well as the expression of differentially expressed genes in different spatial domains of the spatial transcriptome data and different cell types of the corresponding single-cell data.
Function3D: Four Enrichment analyses were conducted on the 3D spatial transcriptome, namely Function Enrichment,GO,KEGG and Cell State. The enrichment analysis results are presented in the form of tables, pictures and 3D models.
Communication3D: Cellular communication analysis of the 3D spatial transcriptome. The results of cell communication analysis are presented in the form of tables, pictures and 3D models.
Users can explore the analysis results in the three-dimensional spatial domain.
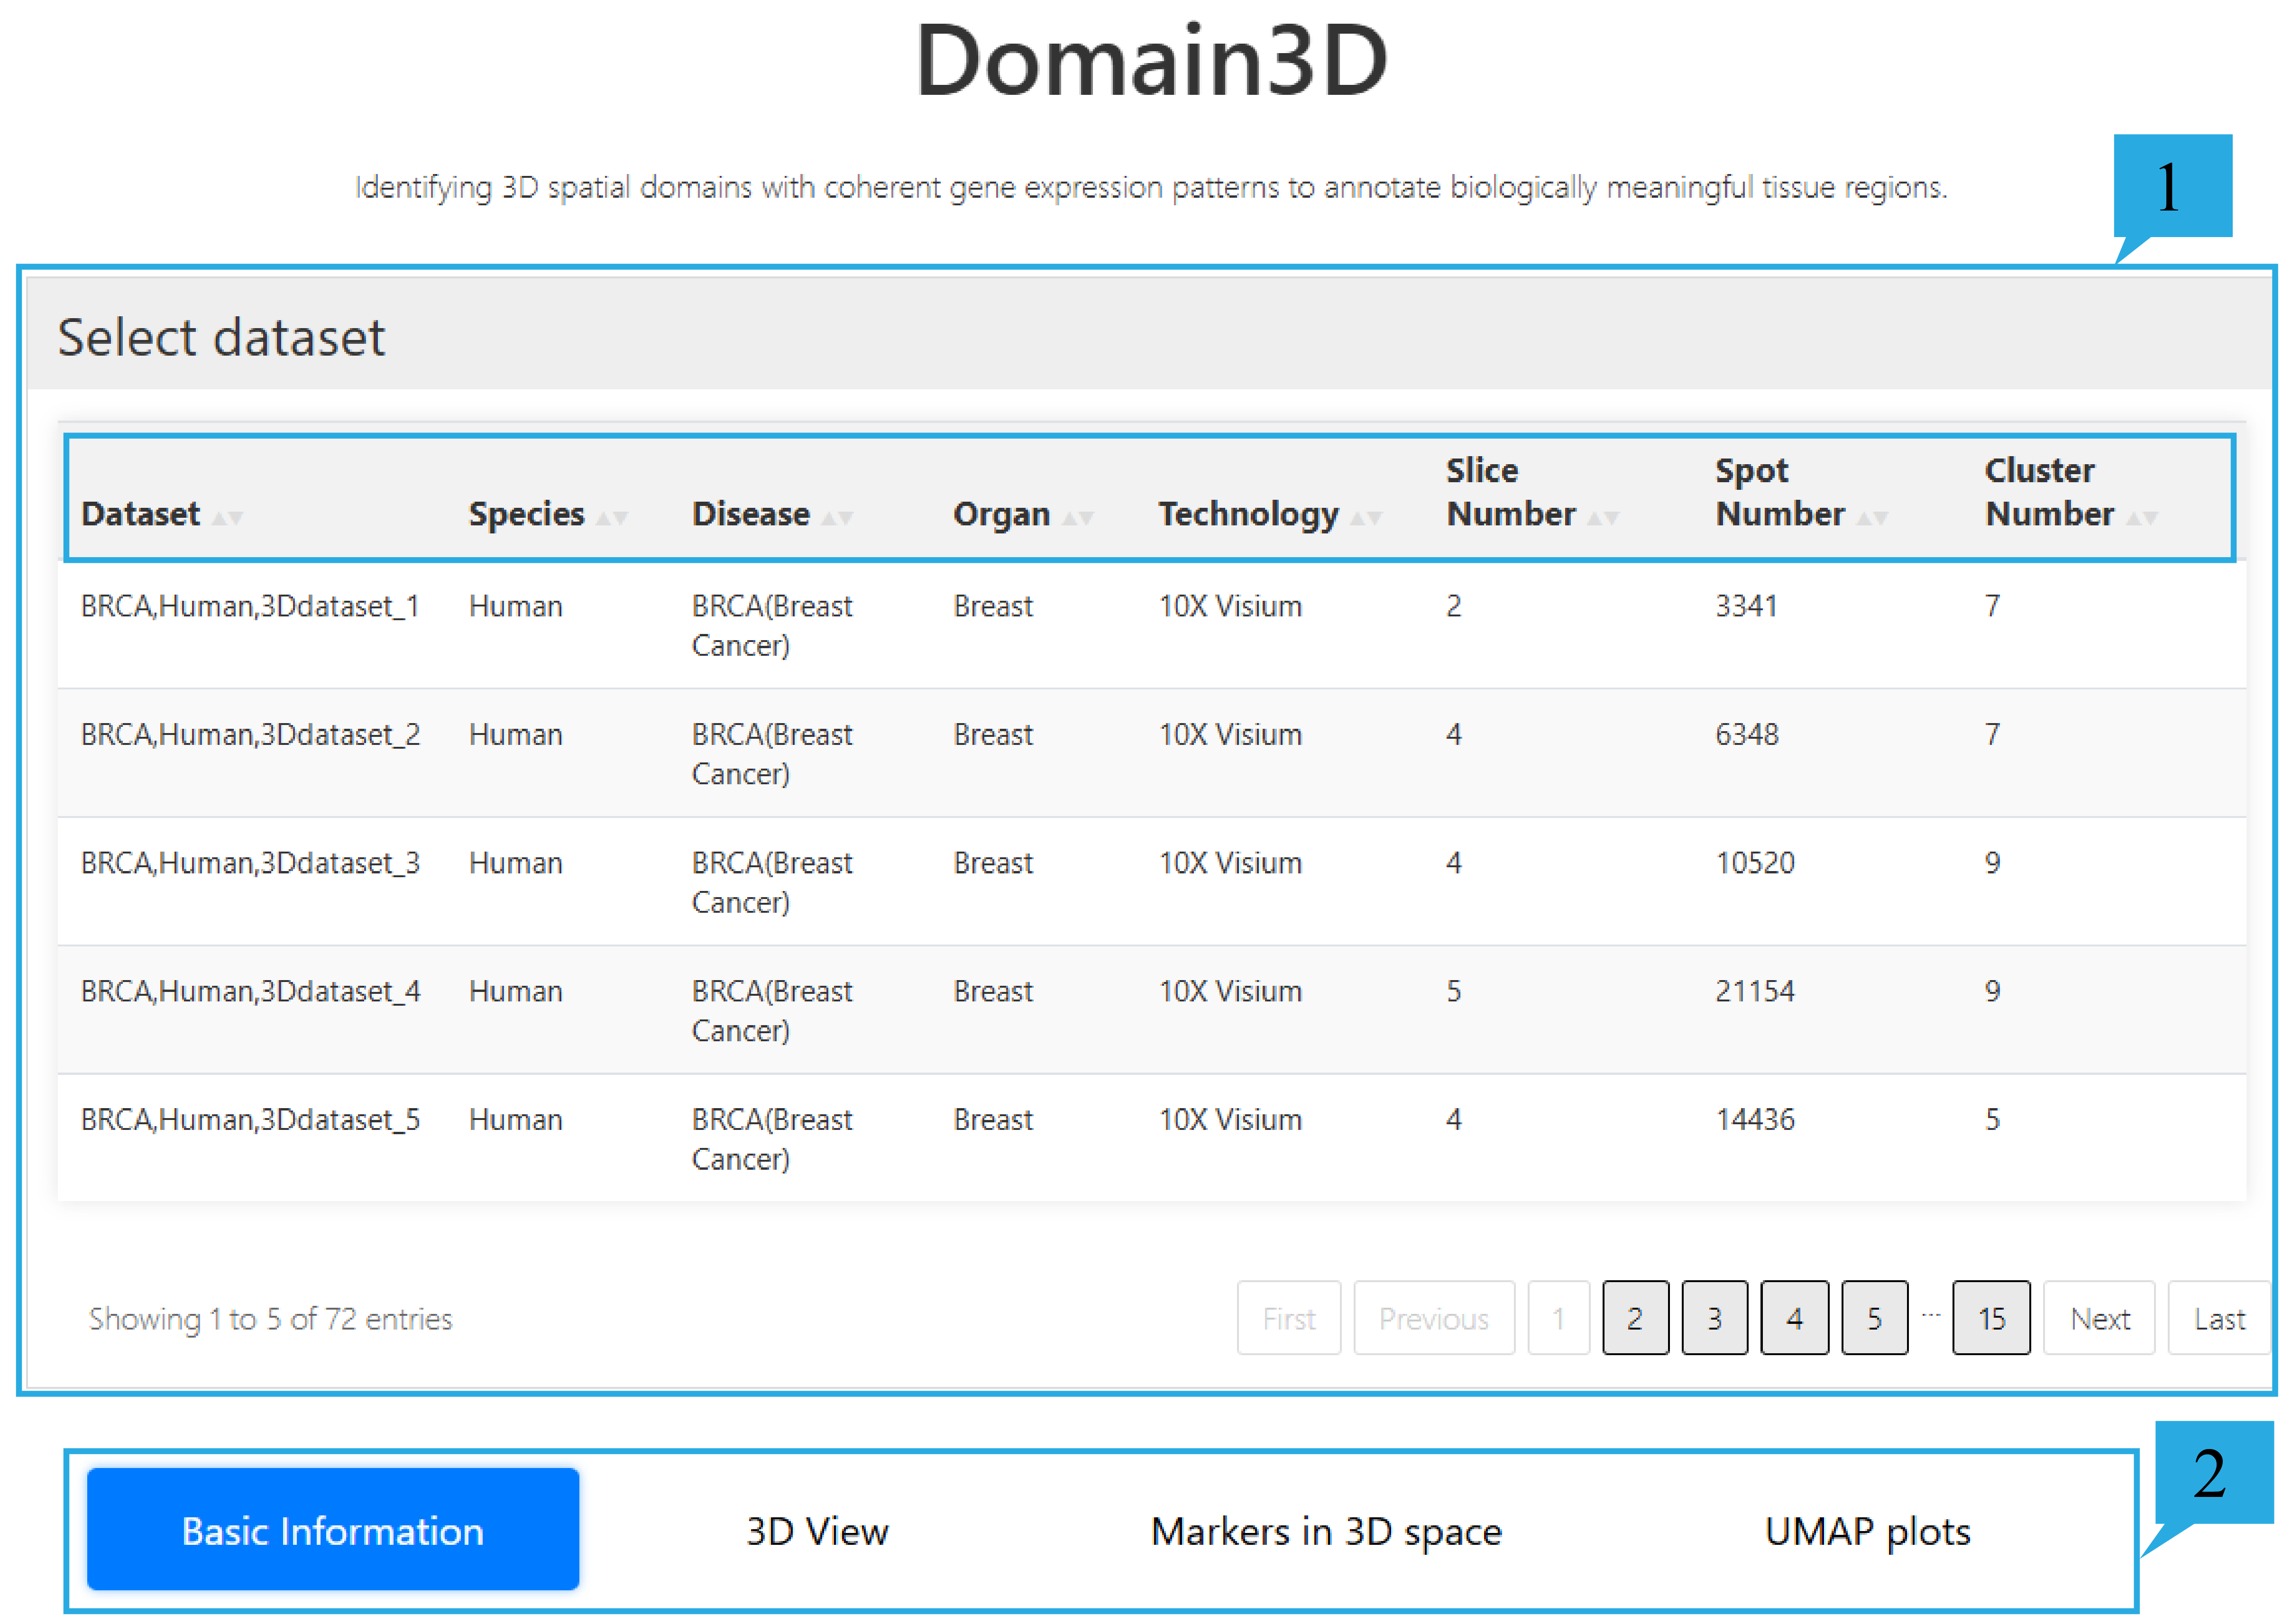
1)select dataset page:
1.This function provides an overview of 72 datasets, including Dataset ID, Species, Disease, Organ, Technology, Slice number, Spot number, and Cluster number. Click on the text can sort the list based on the content of that column. Users can choose the datasets they are interested in as needed.
2. Users can select and view Information about the spatial domain as needed, such as "Basic Information", "3D View", "Marker in 3D space", "UMAP plots".
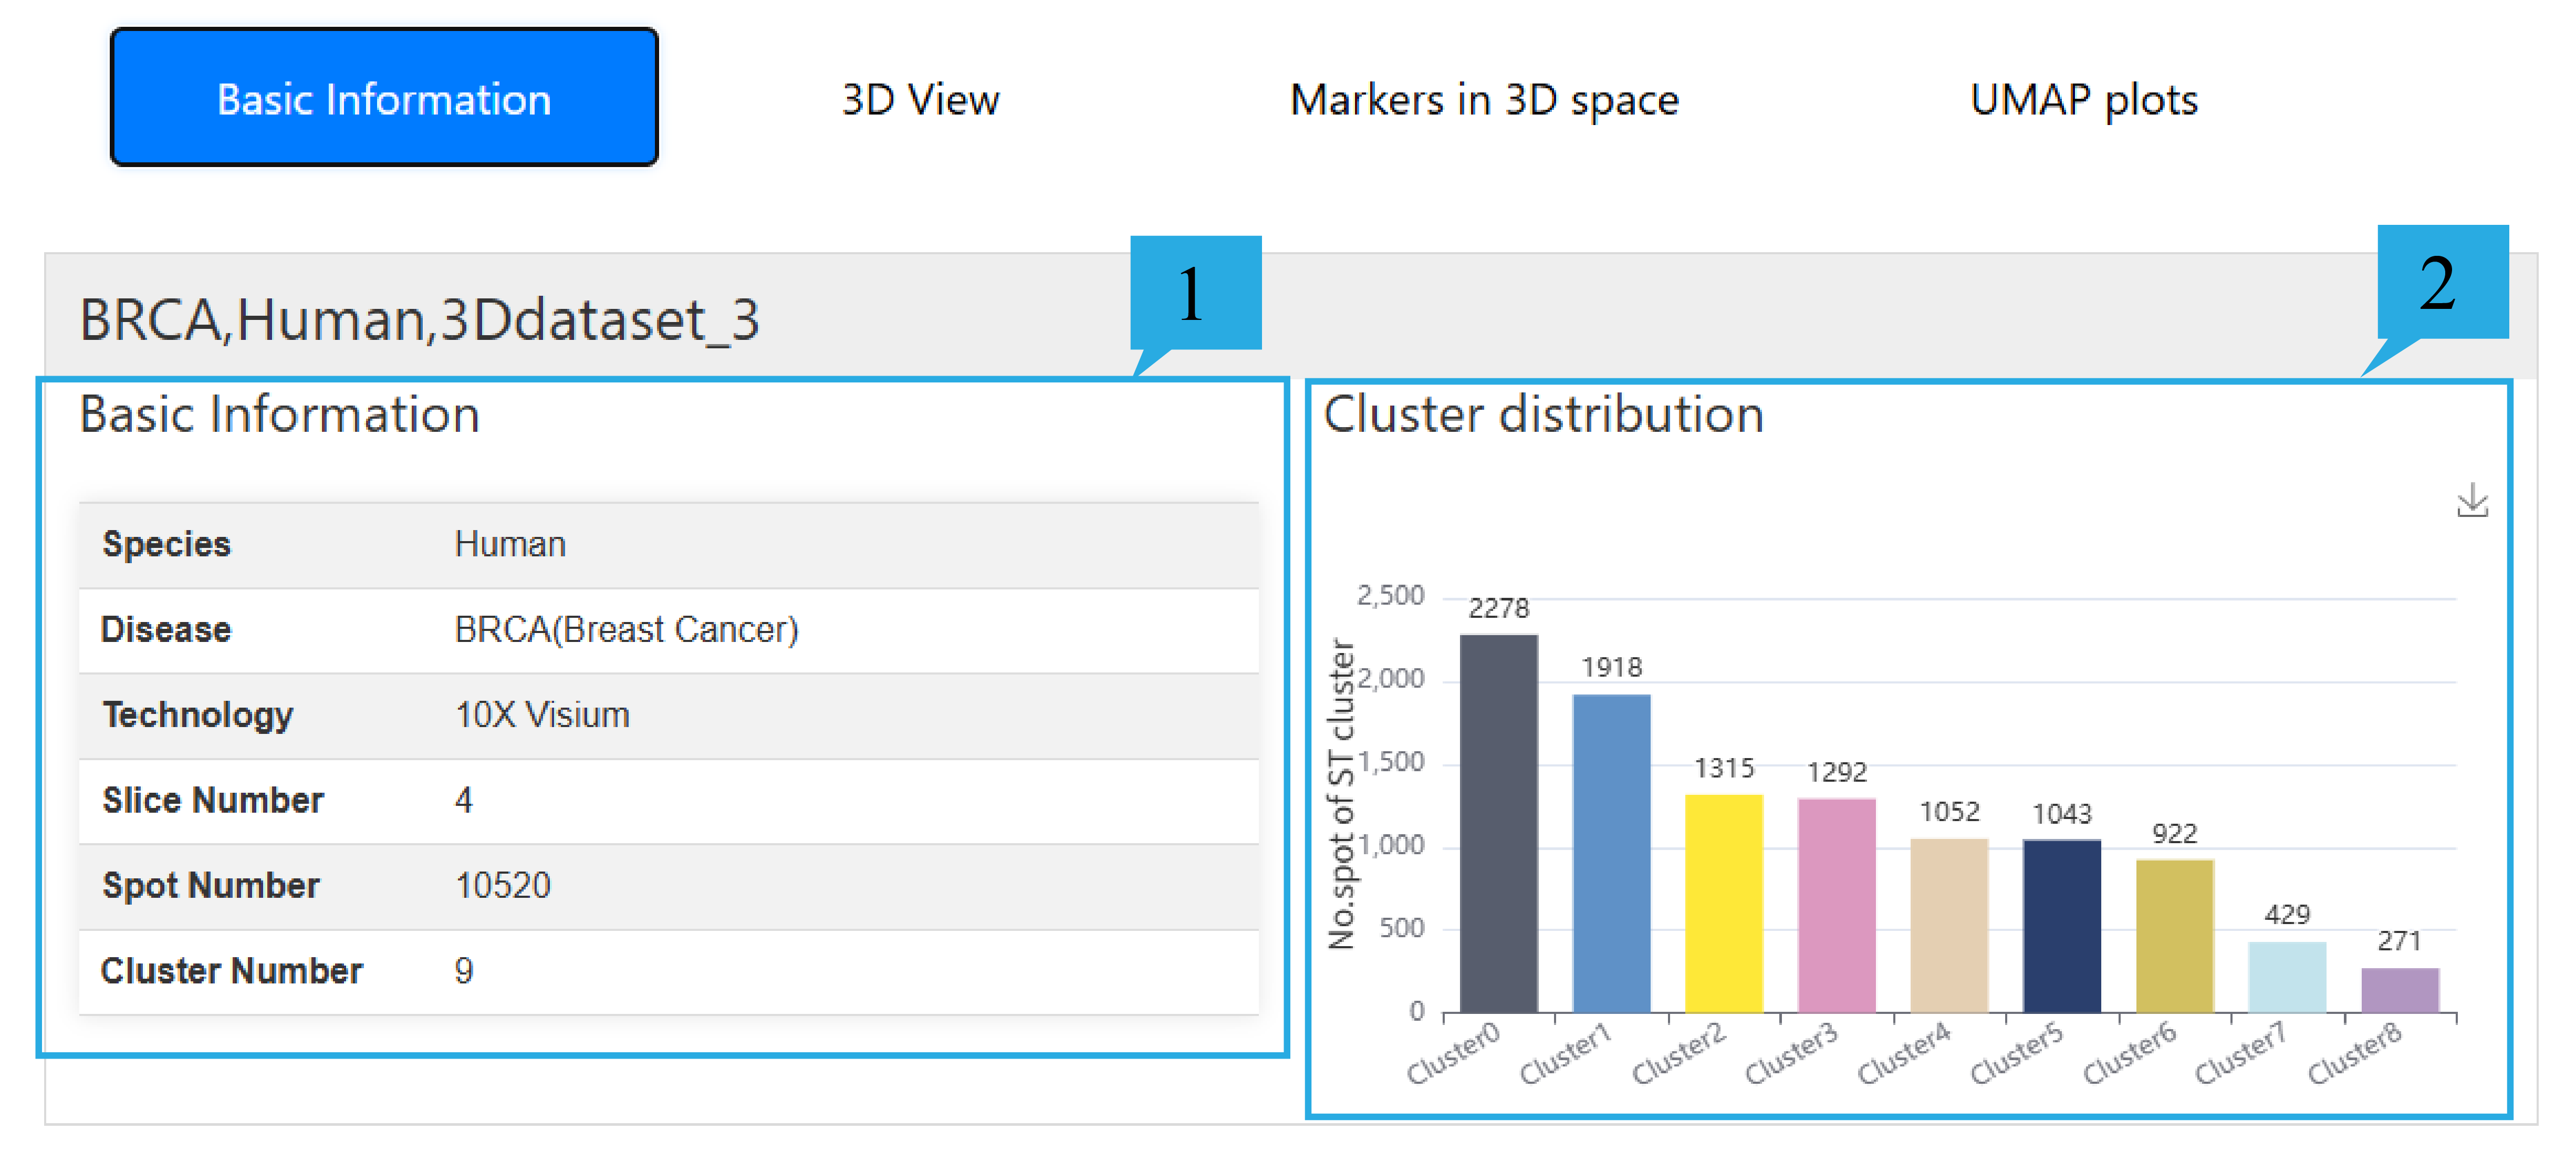
2) “Basic Information”page:
1. The table presents information on the Species, Disease, Sequencing technology, Slice number, Spot number, and Cluster number of this dataset.
2. The histogram is used to count the number of spot in each spatial domain, and the specific number is marked on the histogram.
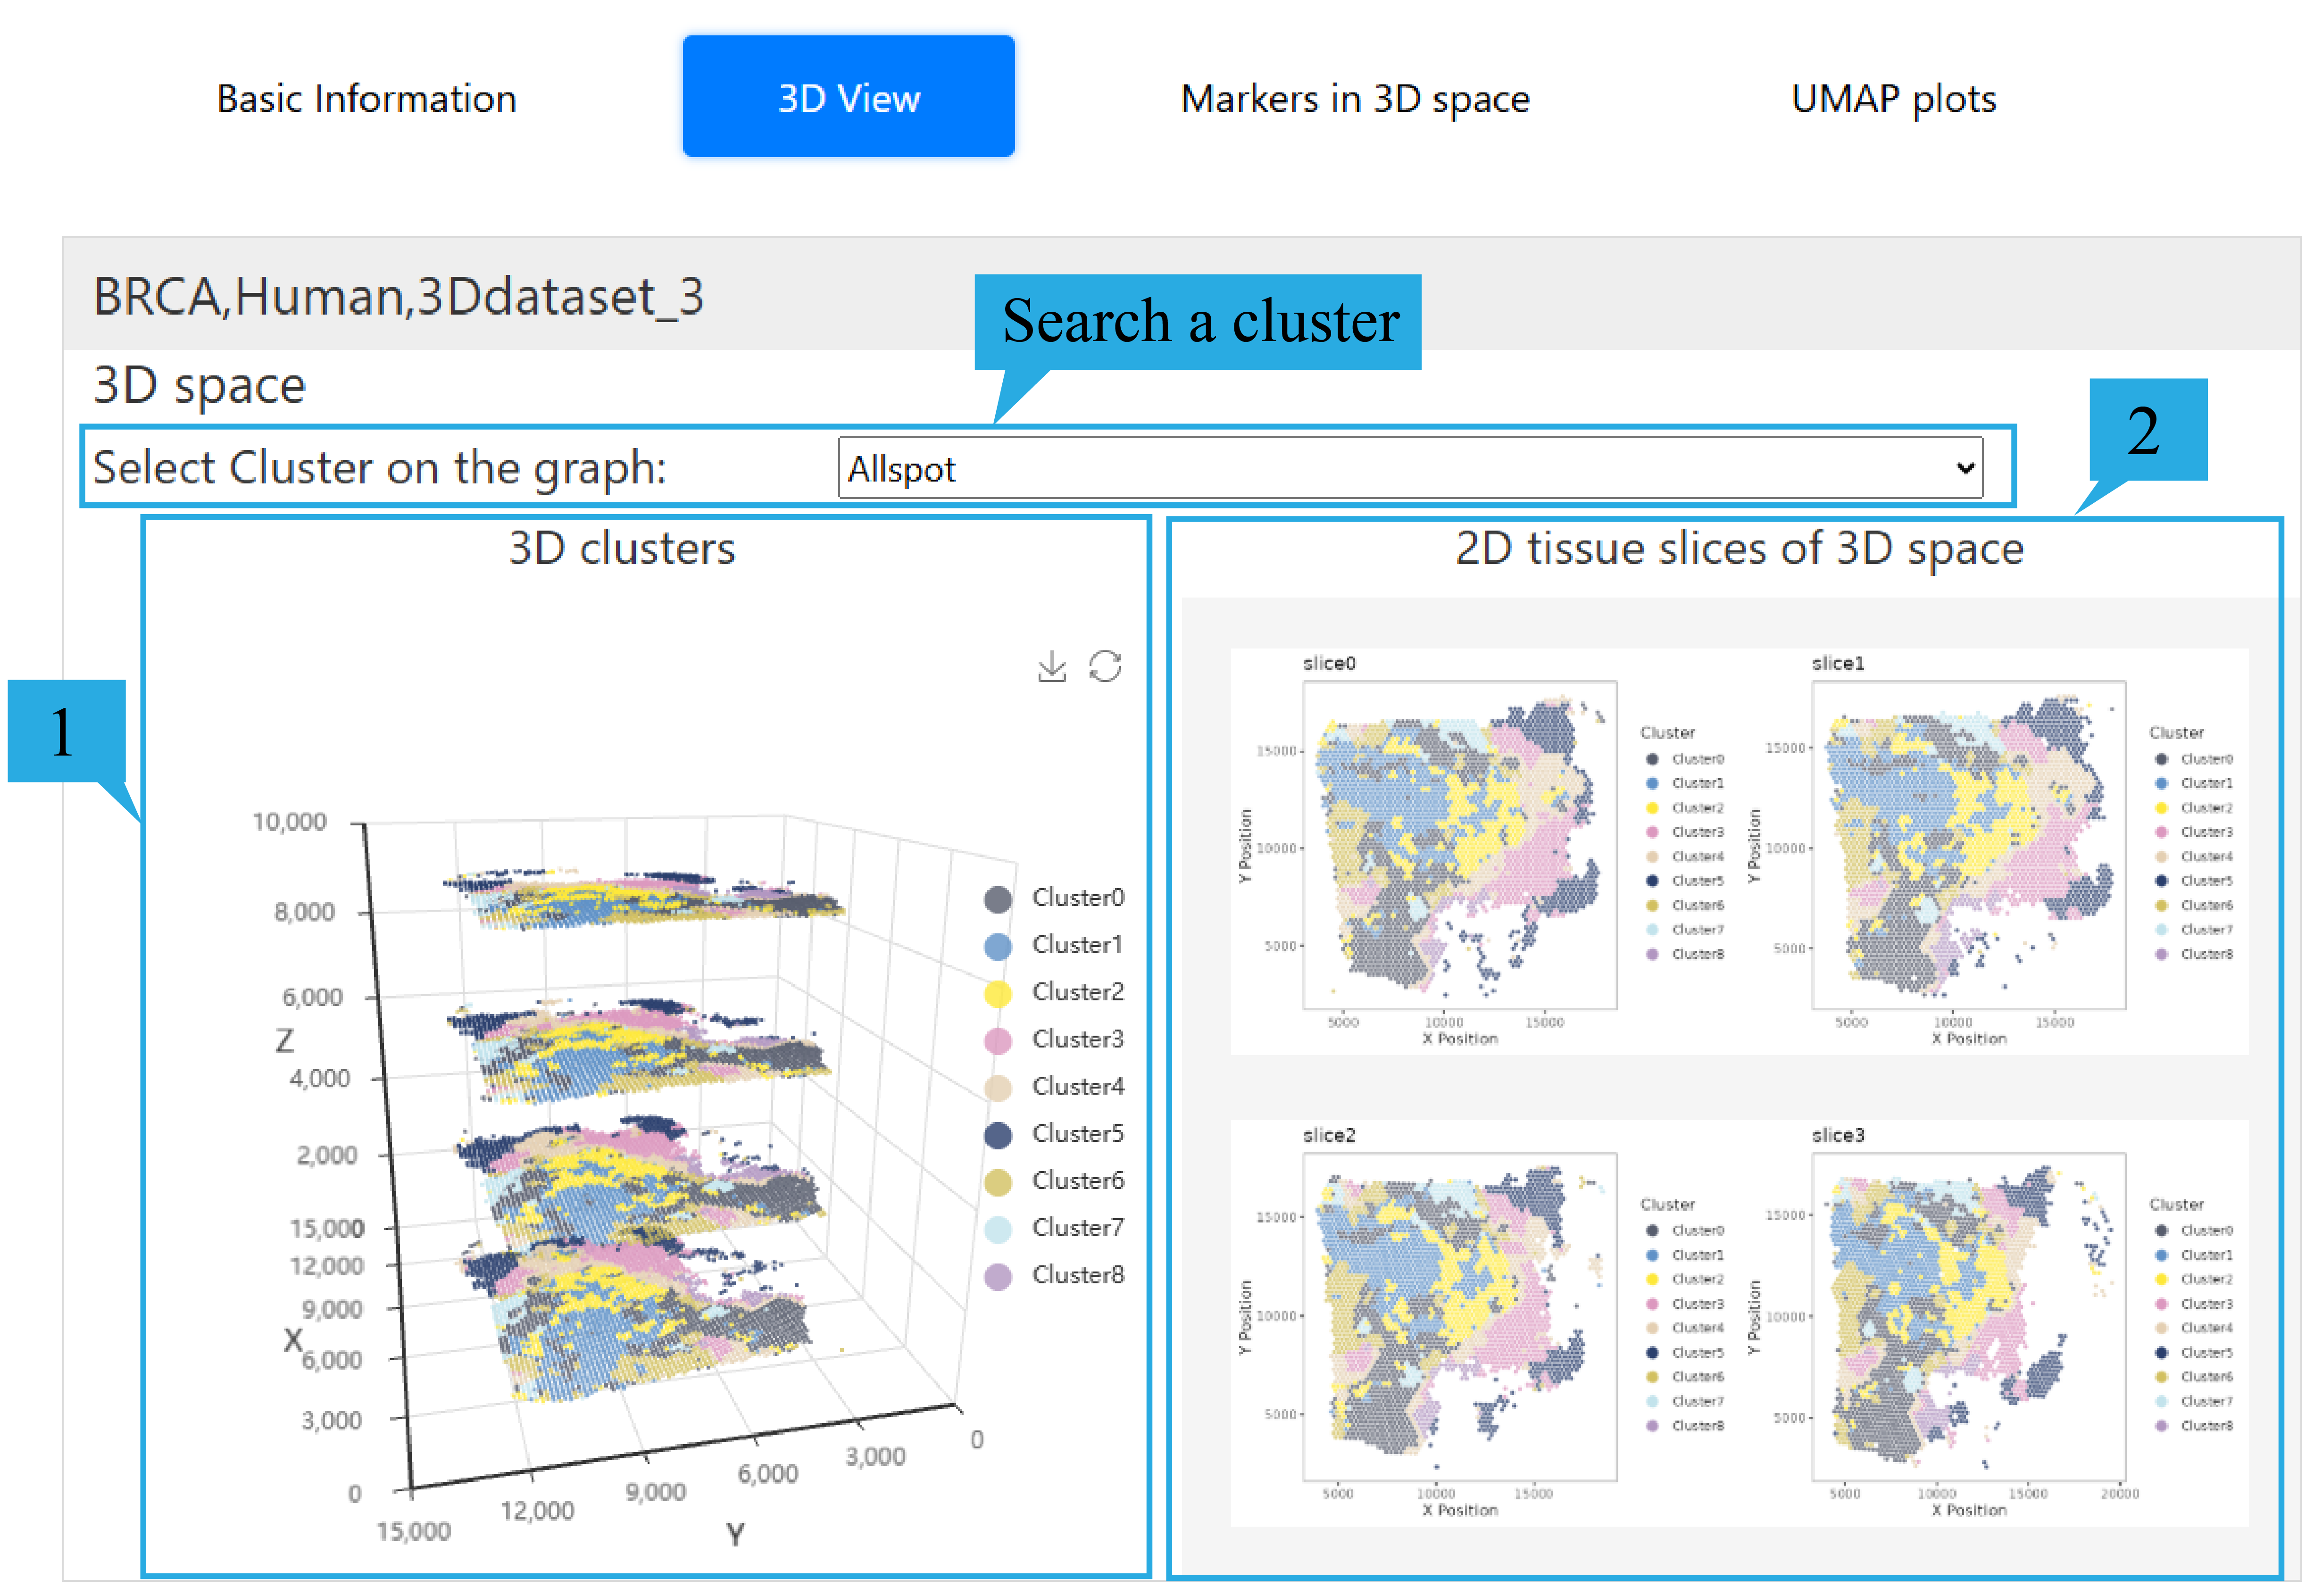
3) “3D View”page:
Users can select the spatial domain they are interested in through the selection box.
1.The 3D model presents the spatial distribution of different spatial domains in 3d spatial transcriptome data. Users can rotate it by dragging with the mouse and zoom in or out by scrolling the mouse wheel. The xyz axes represent the spatial coordinates of the sites. At the same time, users can click on the tags on the right to hide and show the corresponding spatial domains.
2. The 2d clustering maps of each slice are presented, users can click to view the enlarged picture.
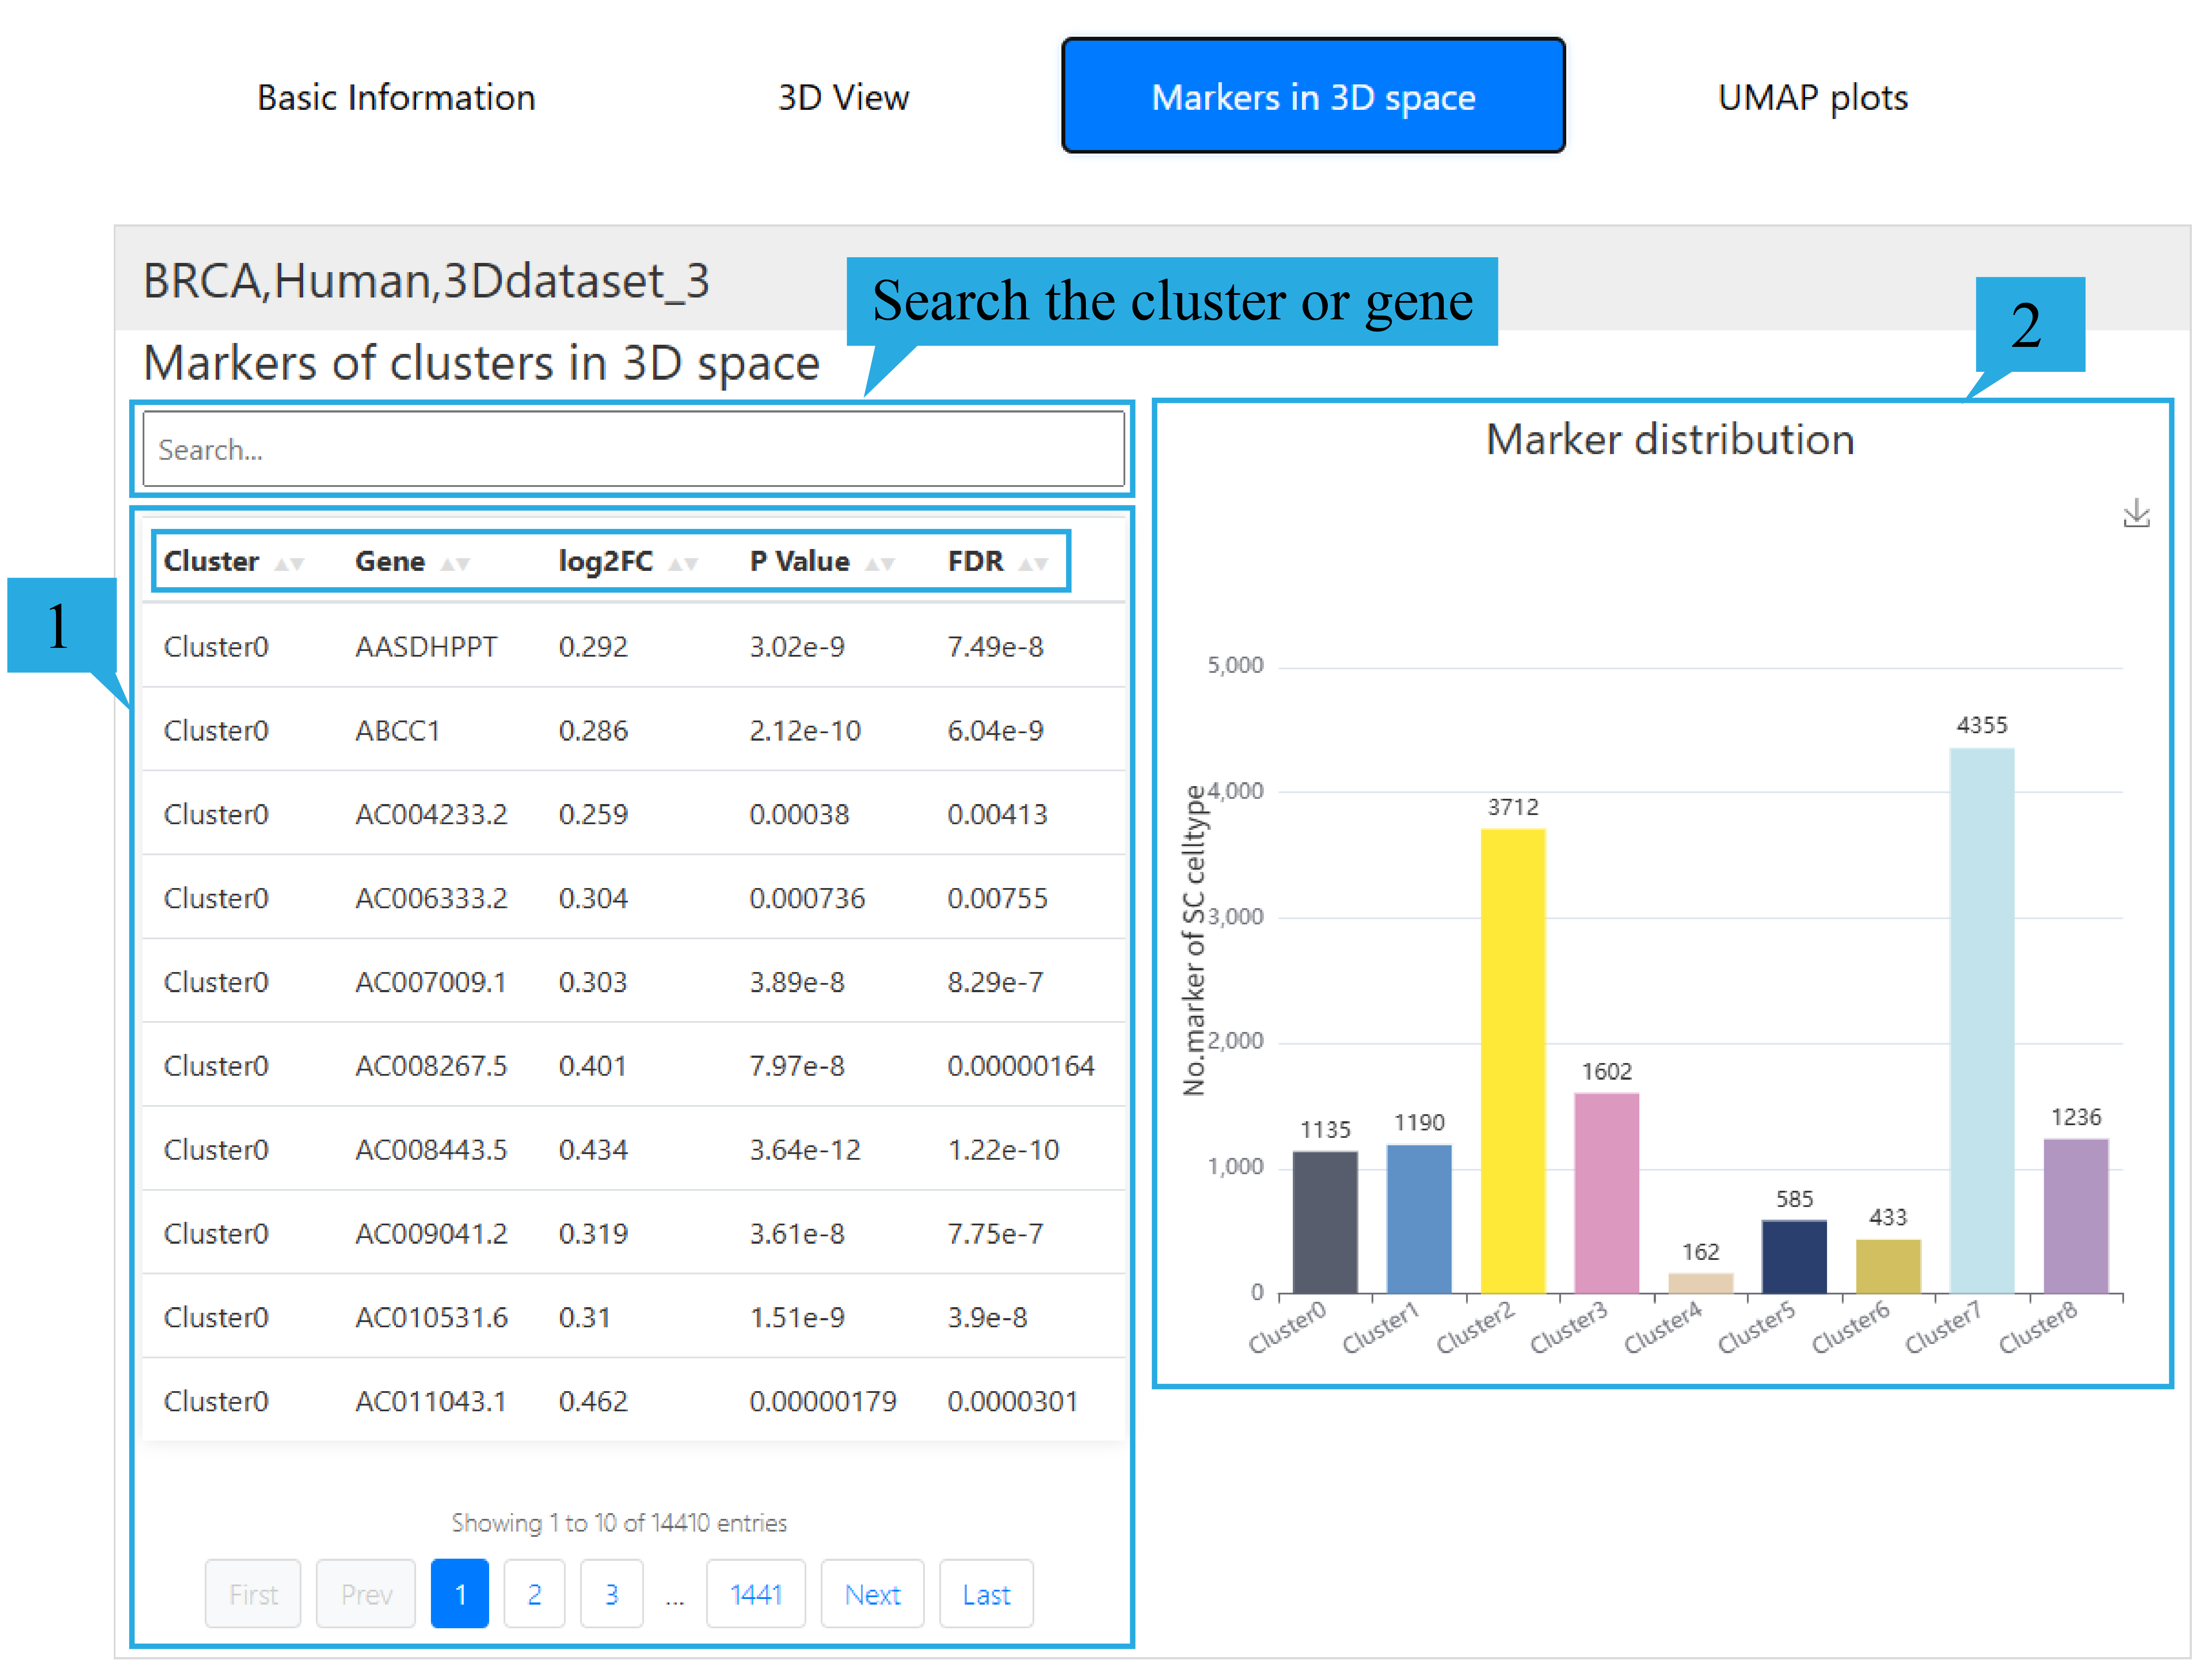
4) “Marker in 3D space”page:
1.The list presents the gene information of differentially expressed genes, including Cluster name, Gene name, log2FC, P-values, and FDR. Click on the text can sort the list based on the content of that column. Users can view the relevant information of their differential genes by entering the spatial domain they are interested in in the search box. At the same time, users can check whether the gene they are interested in is a differential gene and related information by entering it in the search box.
2. The histogram shows the number of differentially expressed genes in different spatial domains.
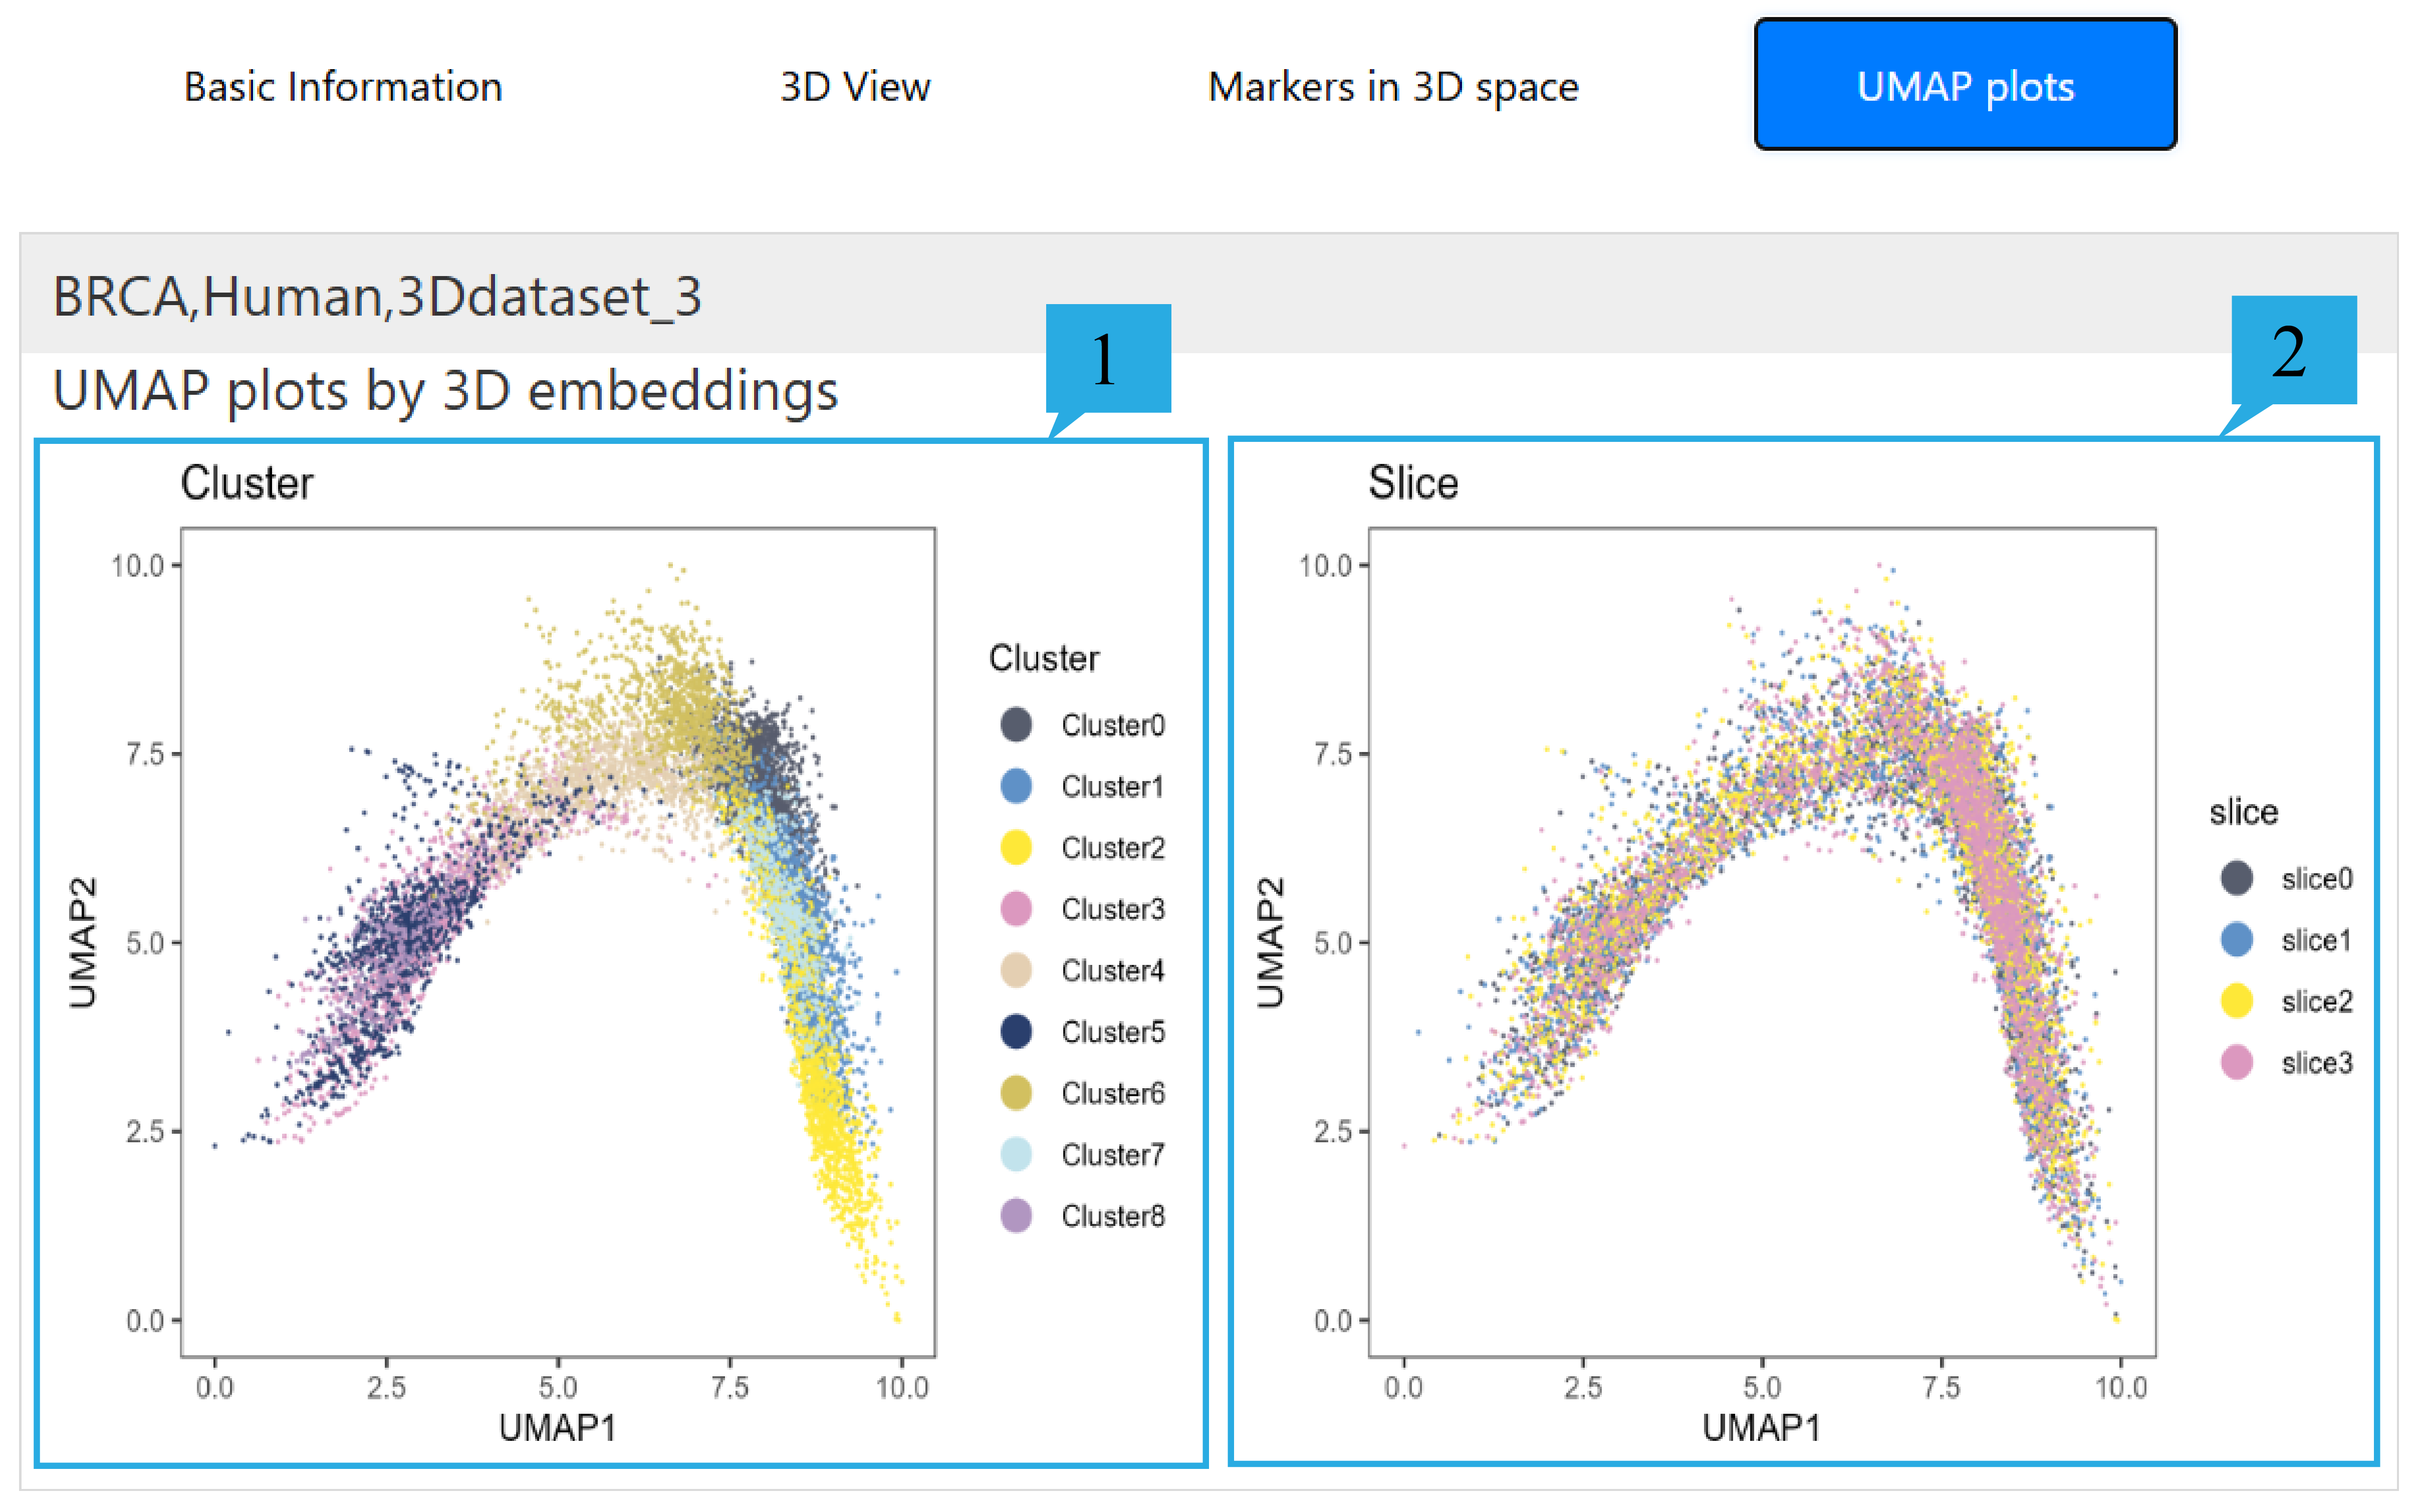
5) “UMAP plots”page:
1.It shows the umap graph based on the clustering results.
2.It shows the umap graph based on slicing.
Users can explore the annotation results and the corresponding single-cell data.
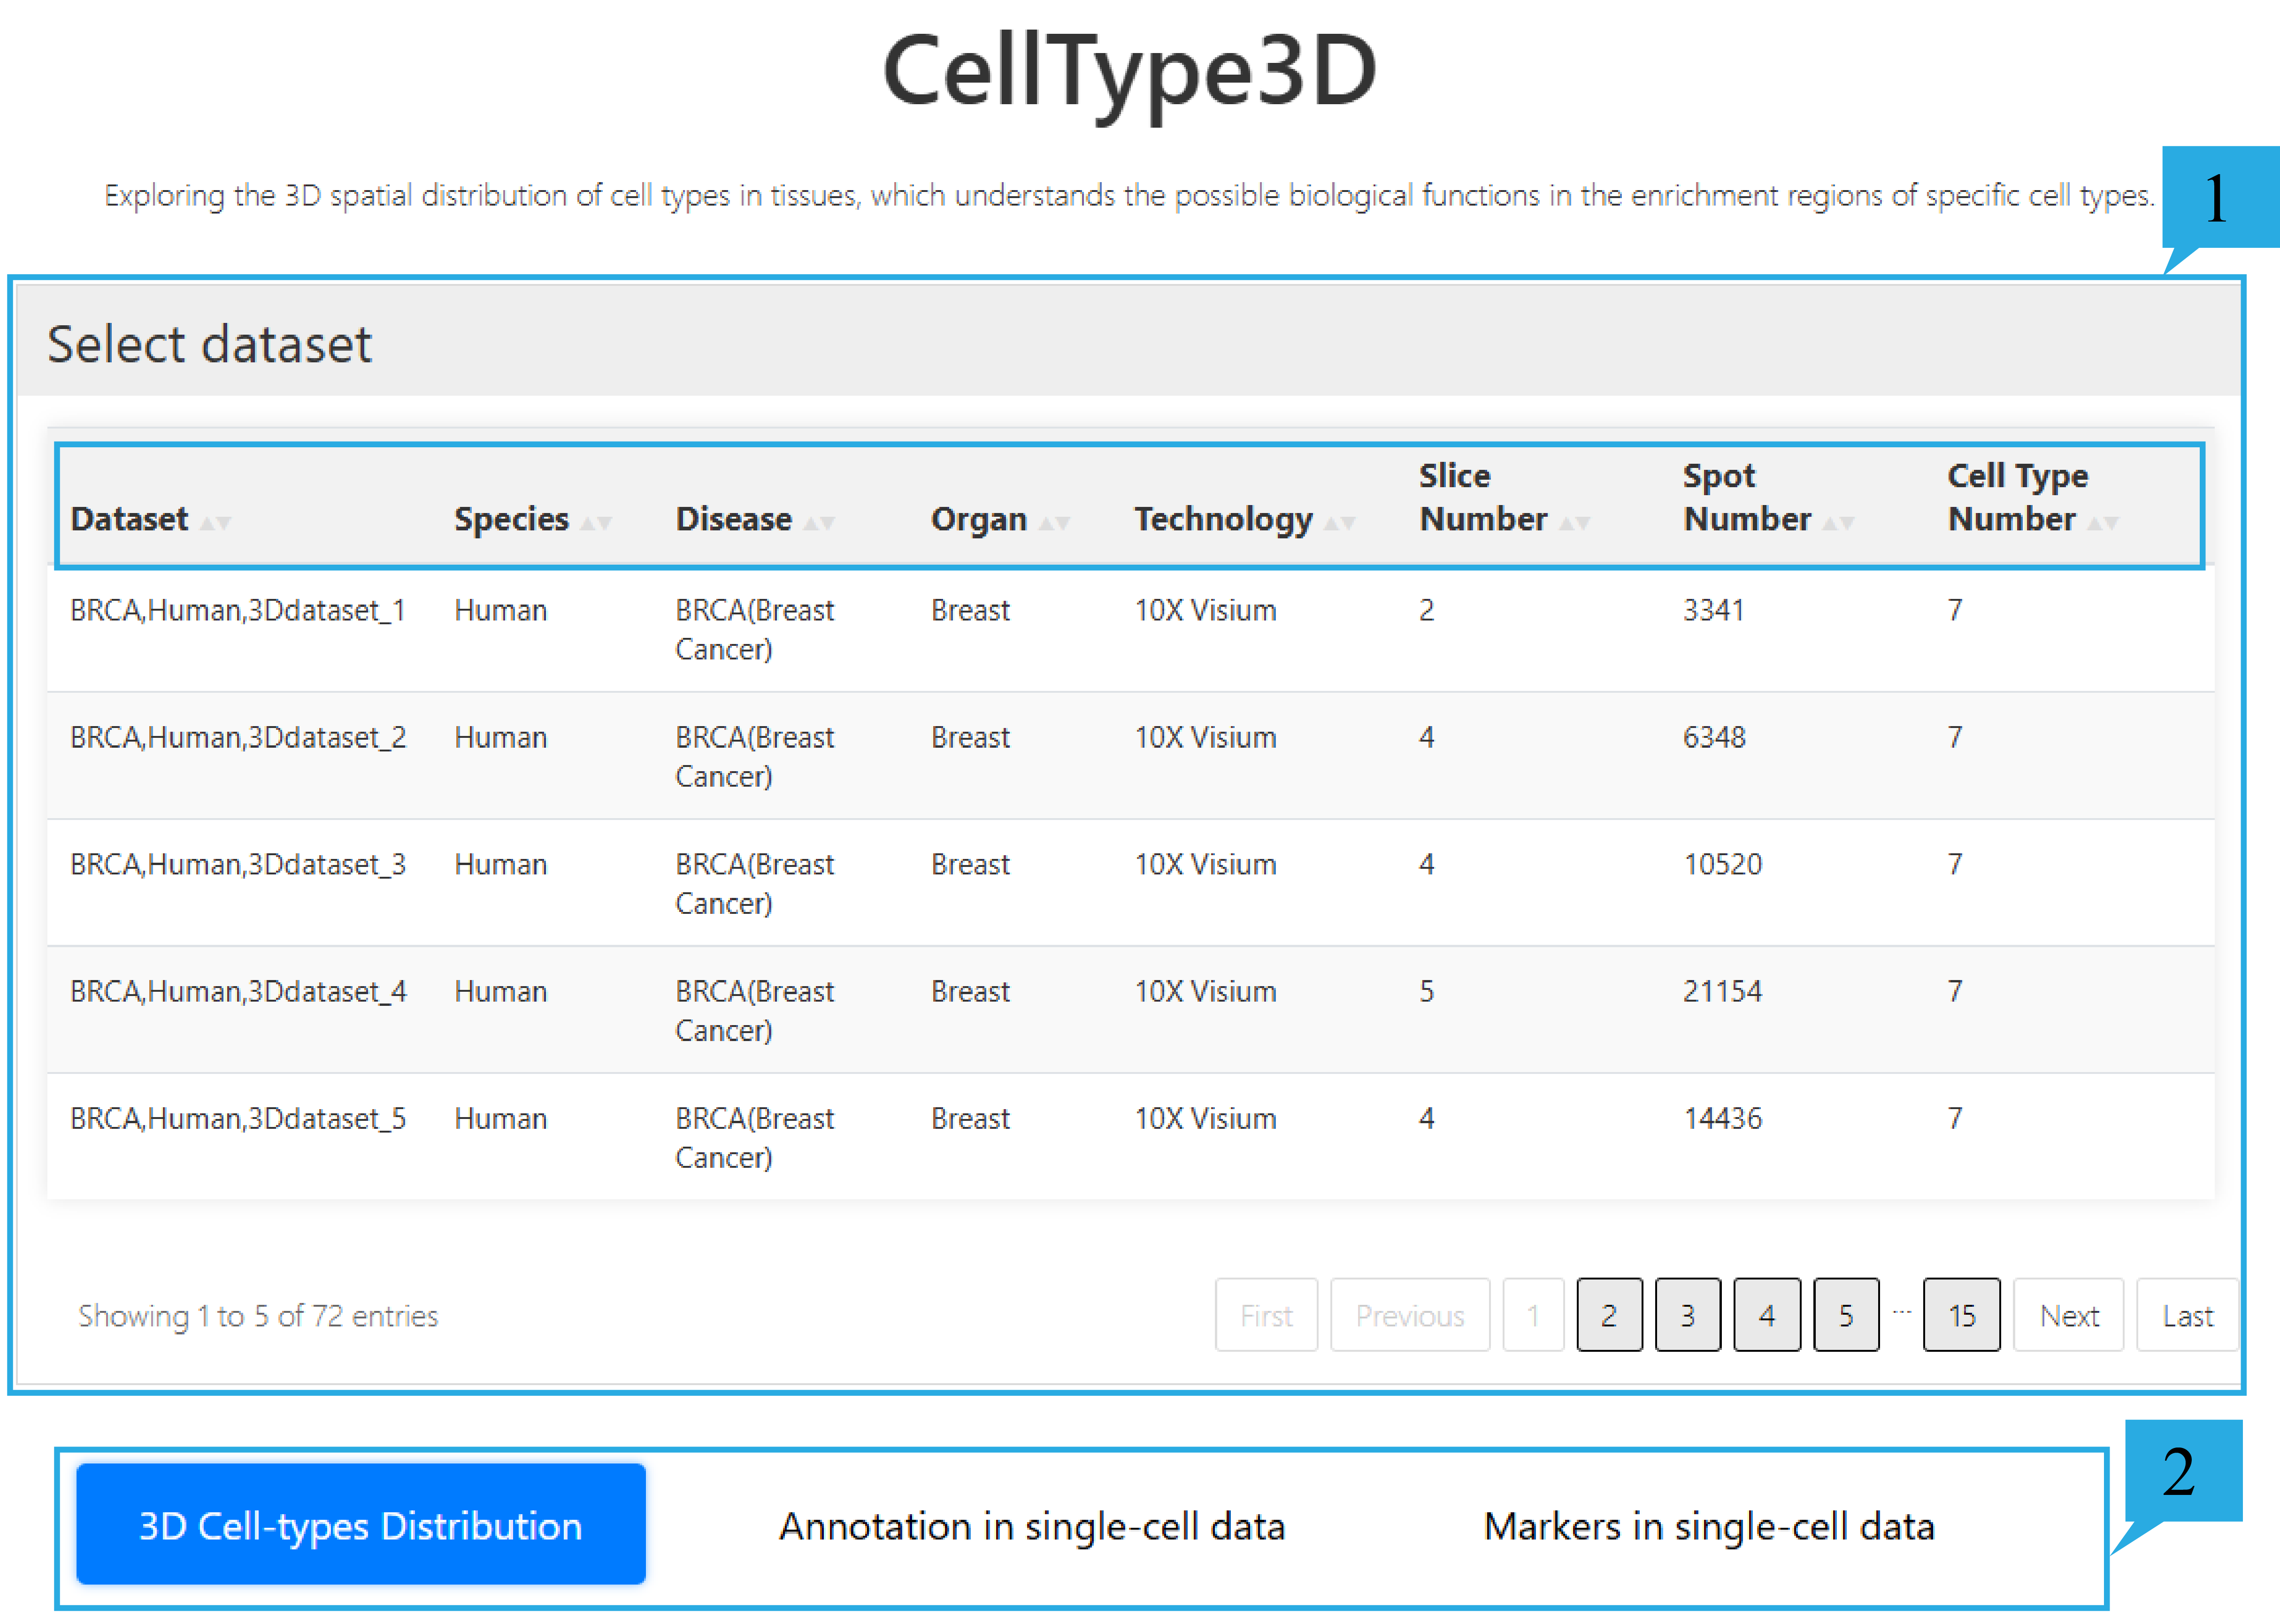
1) select dataset page:
1.This feature provides an overview of 72 datasets, including Dataset ID, Species, Disease, Organ, Sequencing technology, Slice number, Spot number, and Cell type number. Click on the text can sort the list based on the content of that column. Users can choose the datasets they are interested in as needed.
2. Users can select and view relevant information about cell Annotation as needed, such as "3D Celltype Distribution", "Annotation in single-cell data", and "Markers in single-cell data".
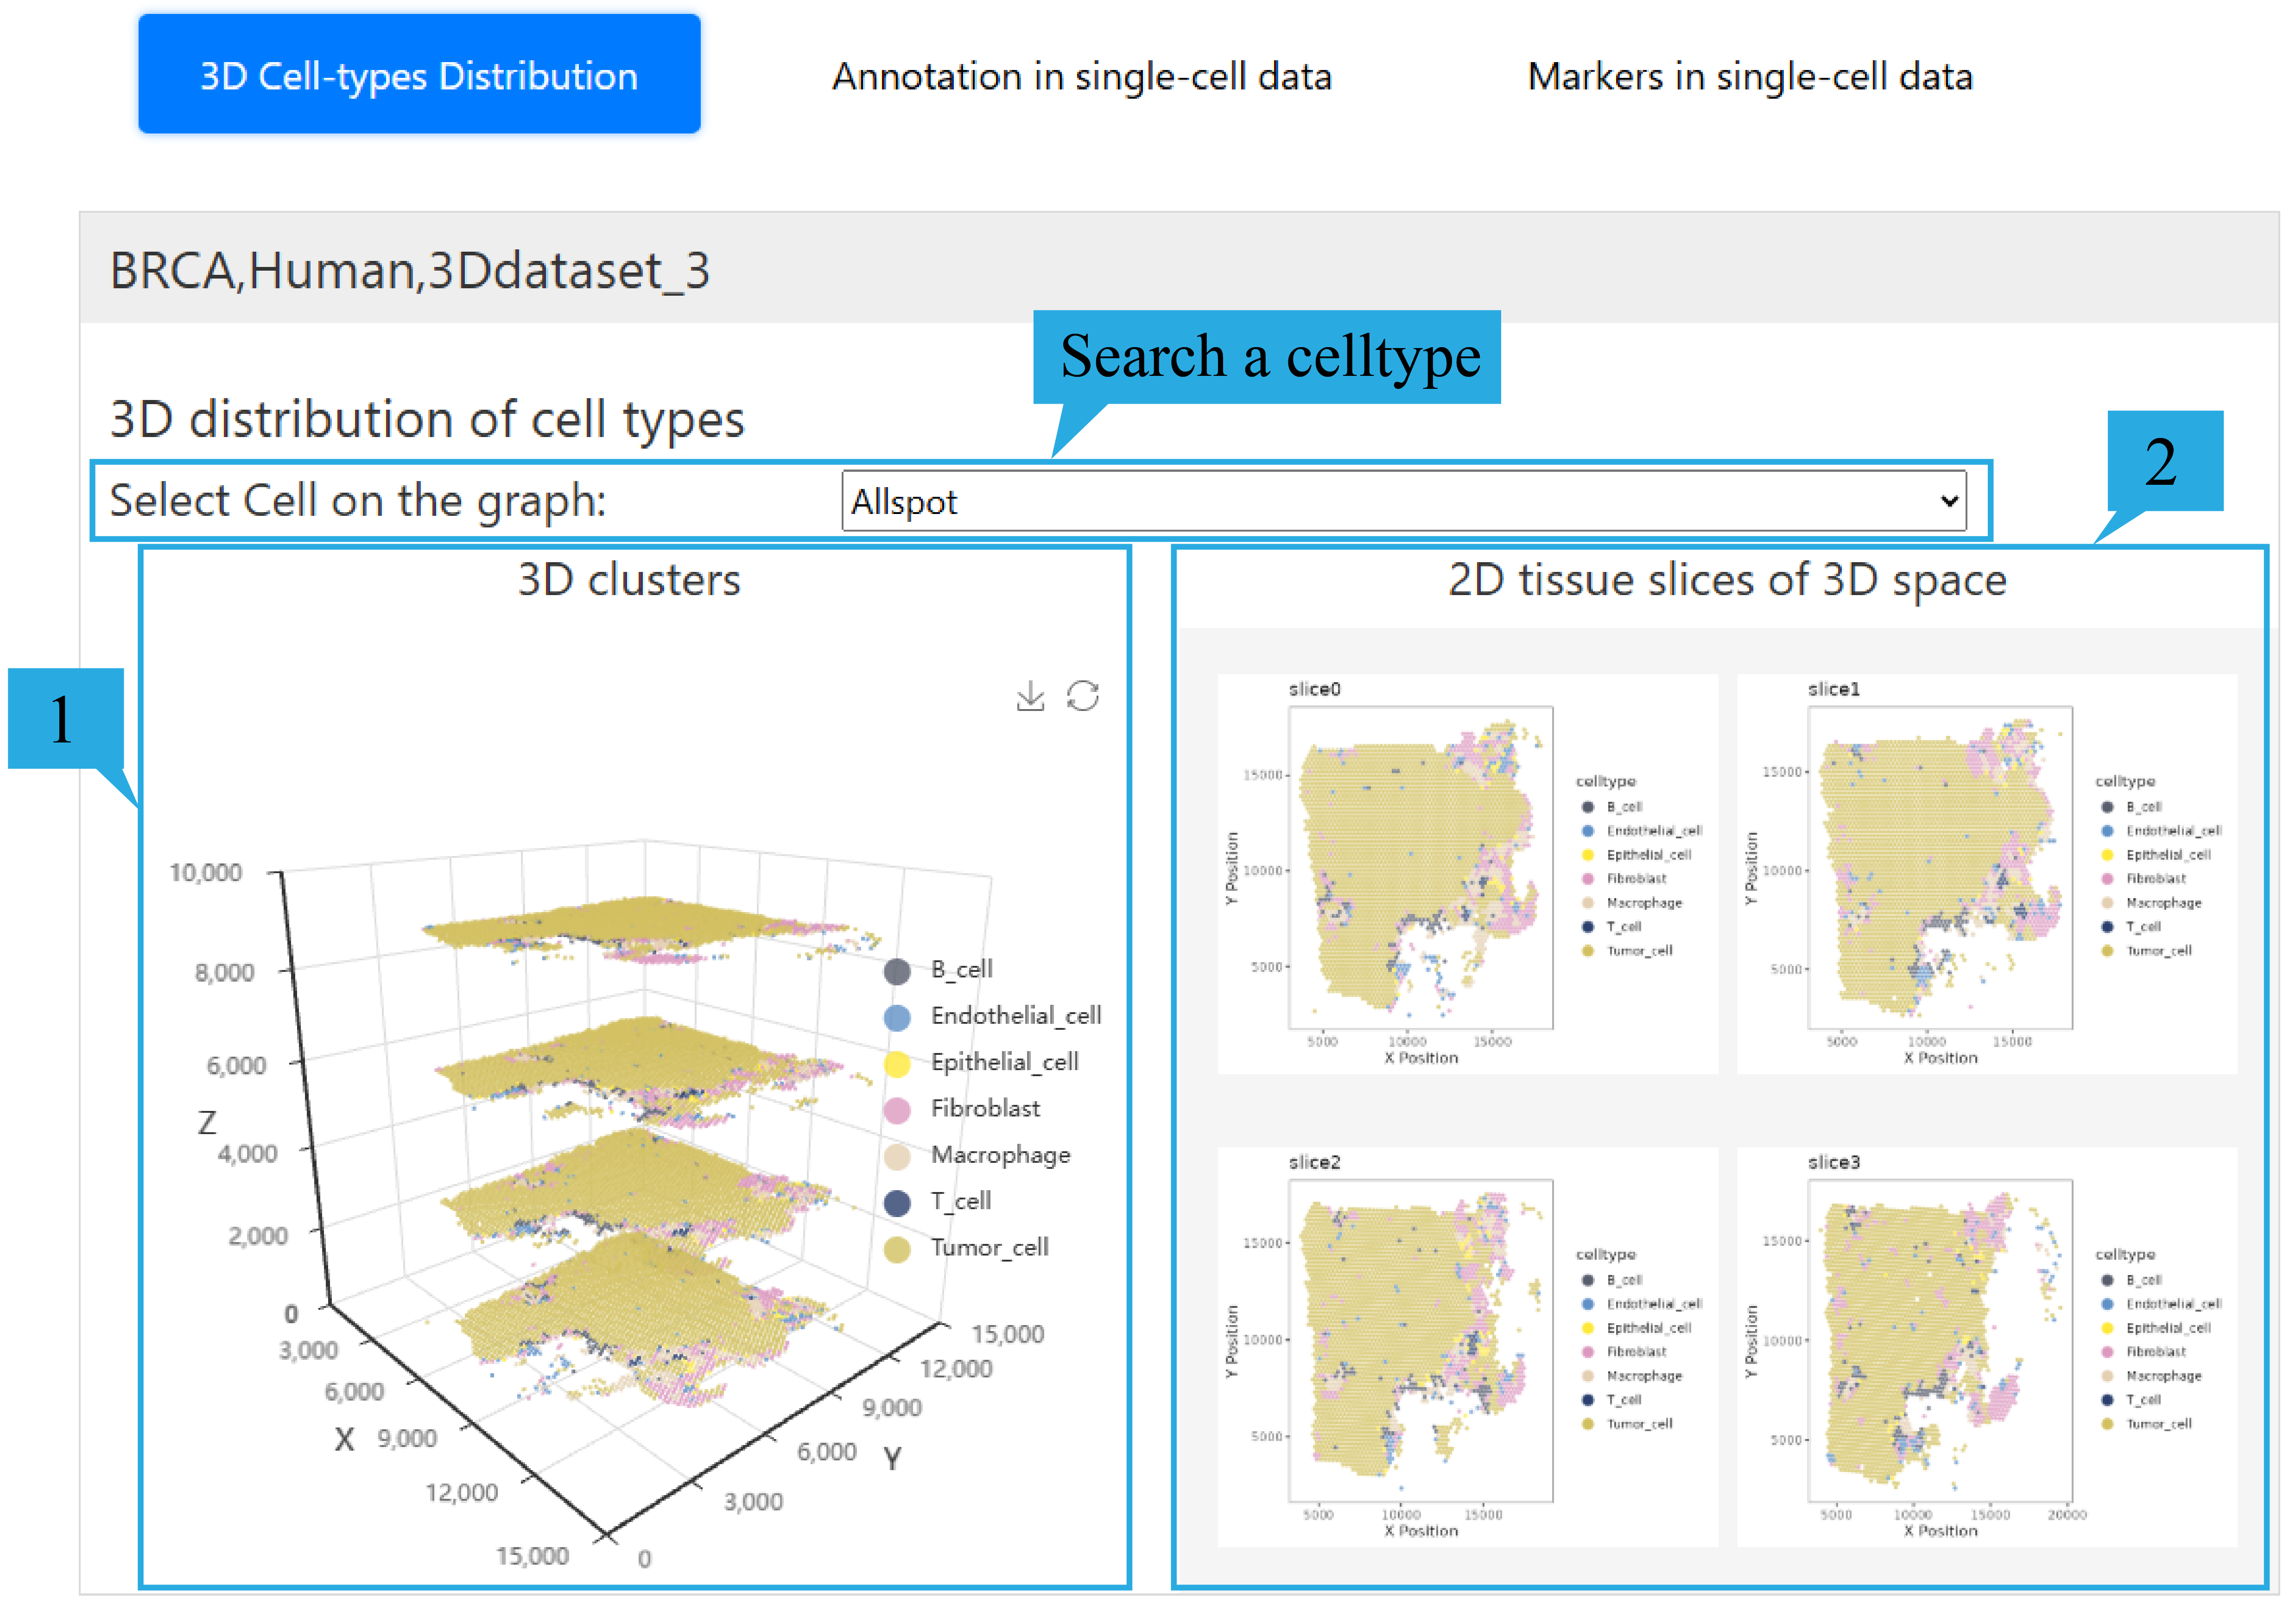
2) “3D Celltype Distribution”page:
Users can select the cell types they are interested in through the selection box.
1.The 3D model presents the spatial distribution of different types of cells in 3d spatial transcriptome data. Users can rotate it by dragging with the mouse and zoom in or out by scrolling the mouse wheel. The xyz axes represent the spatial coordinates of the sites. At the same time, users can click on the tags on the right to hide and display the corresponding cell types.
2. 2d cell type maps of each section are displayed, and users can click to view the enlarged images.
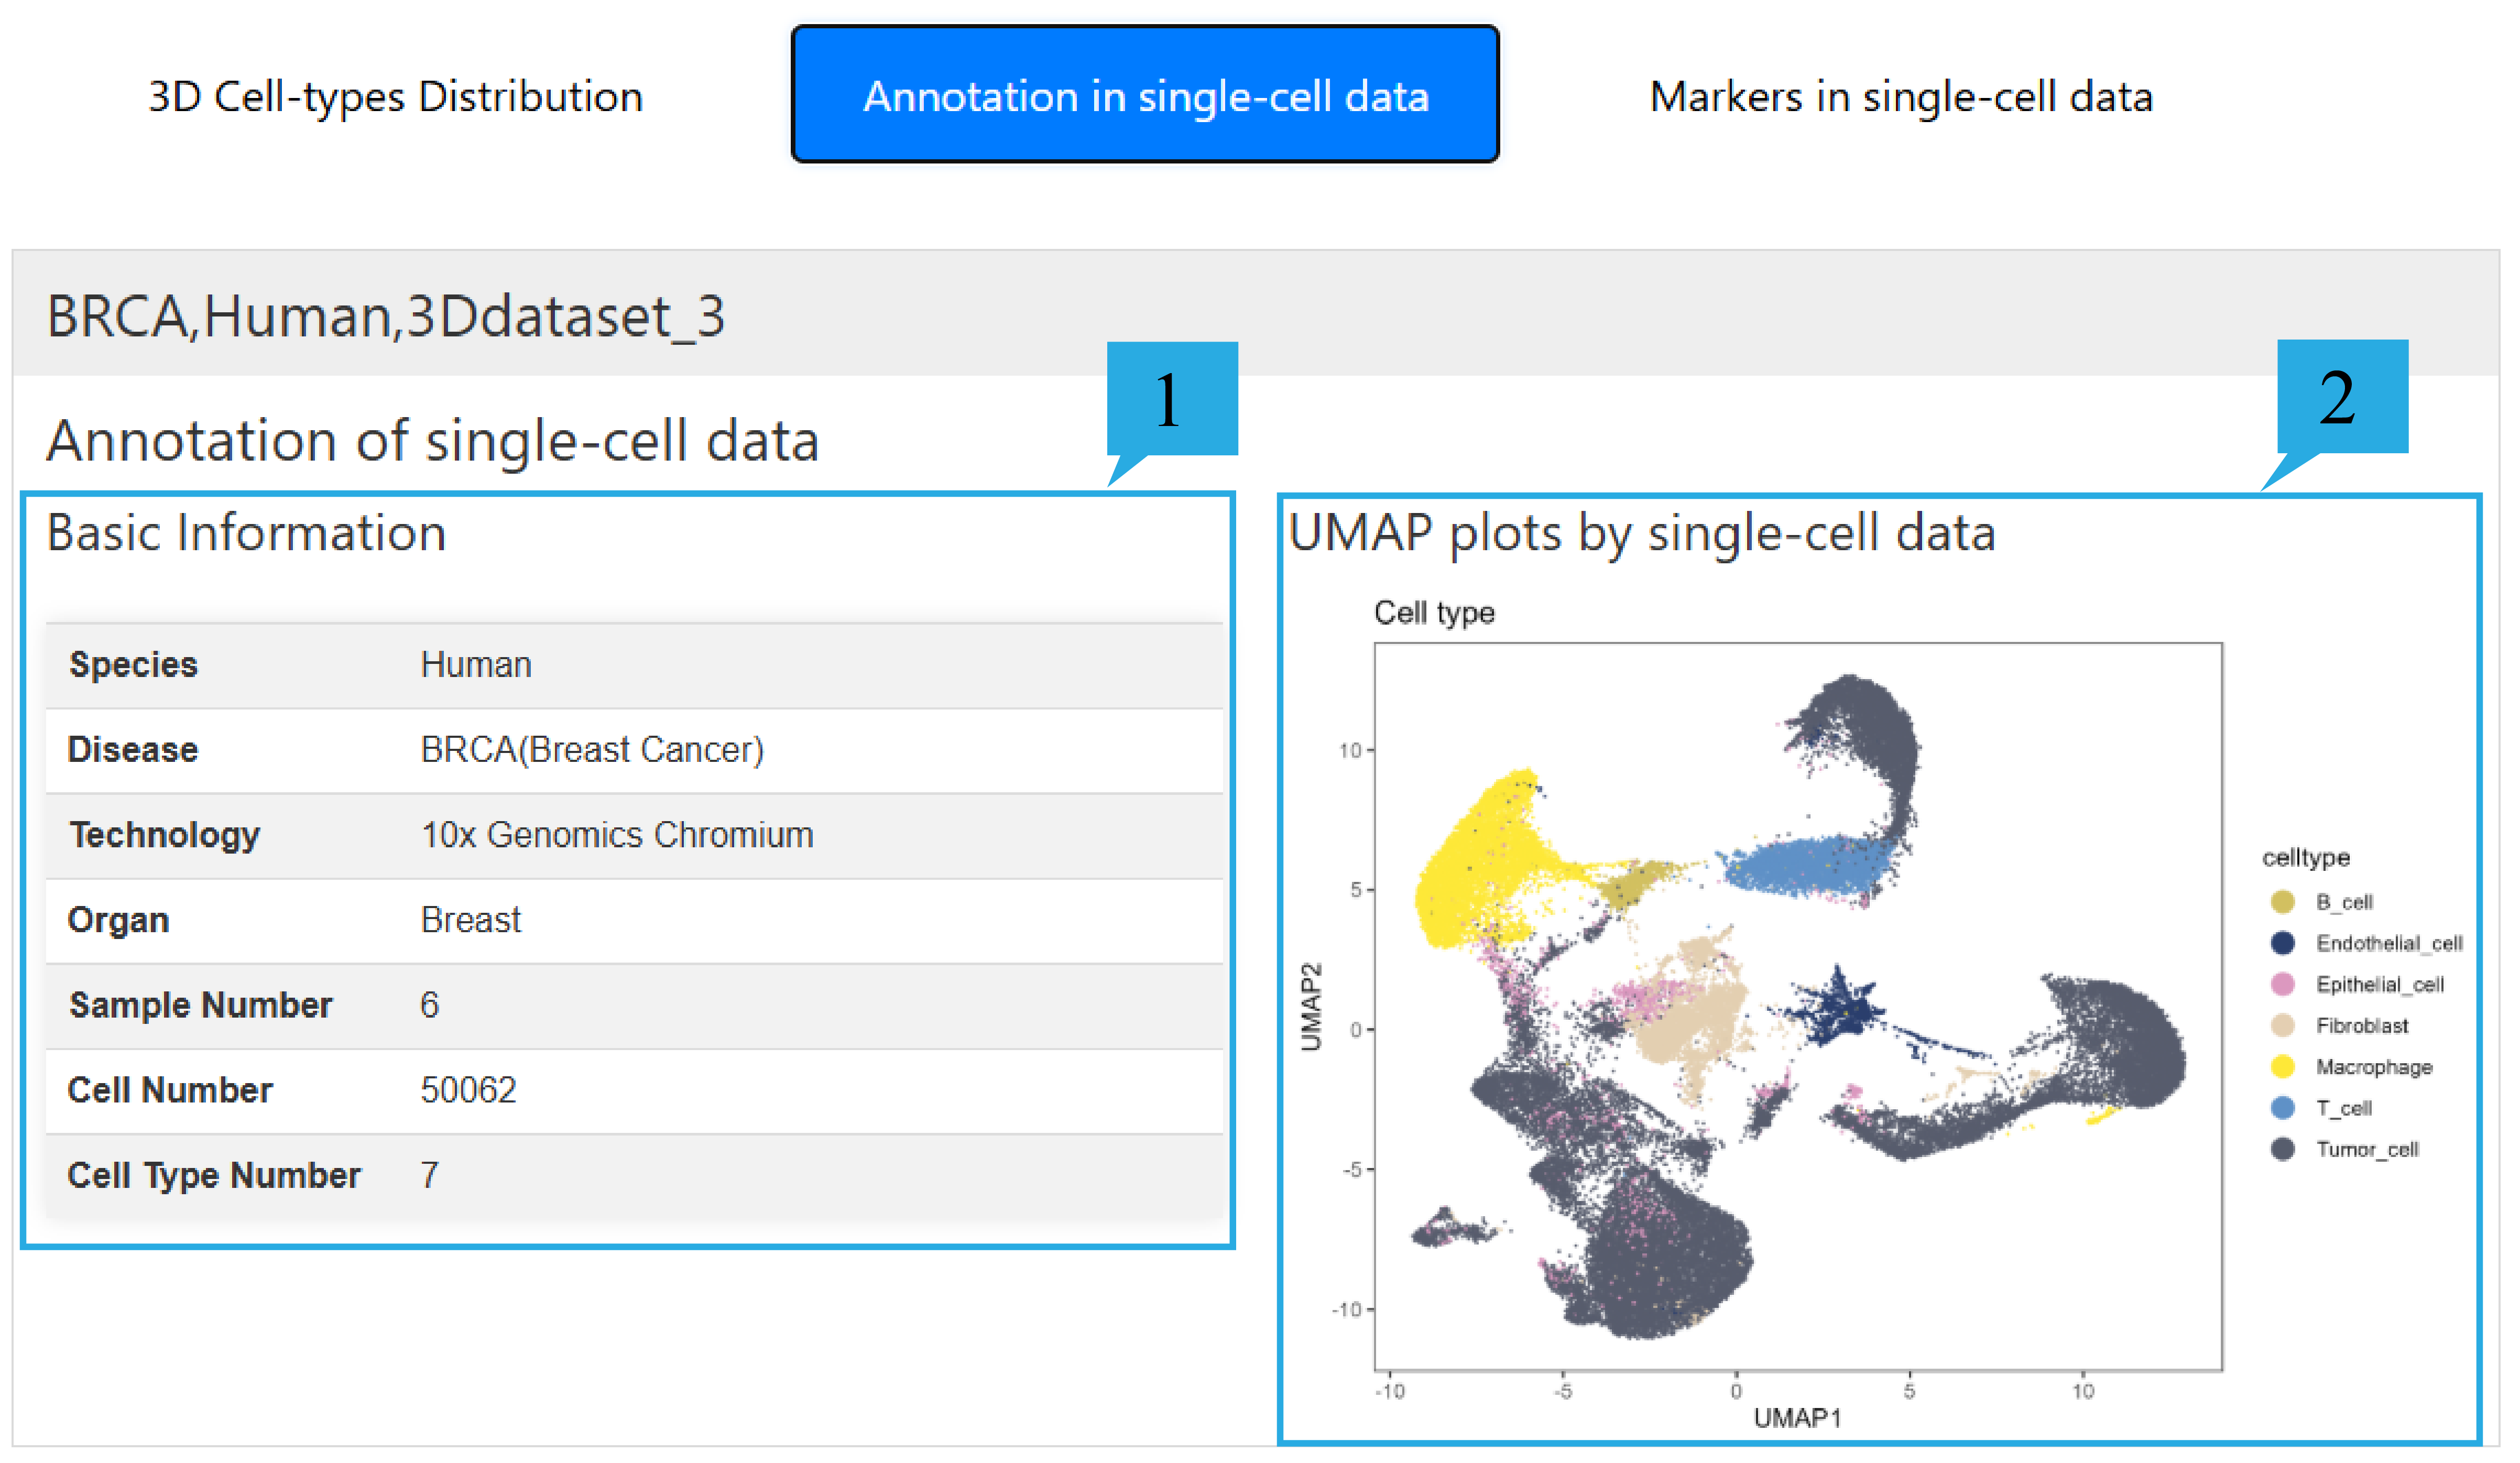
3) “Annotation in single-cell data”page:
1.The table presents the basic information of single-cell data, including Species, Disease, Sequencing technology, Organ, Sample number, Cell number and Cell type number.
2. It presents the umap graph of single-cell data based on the annotation results.
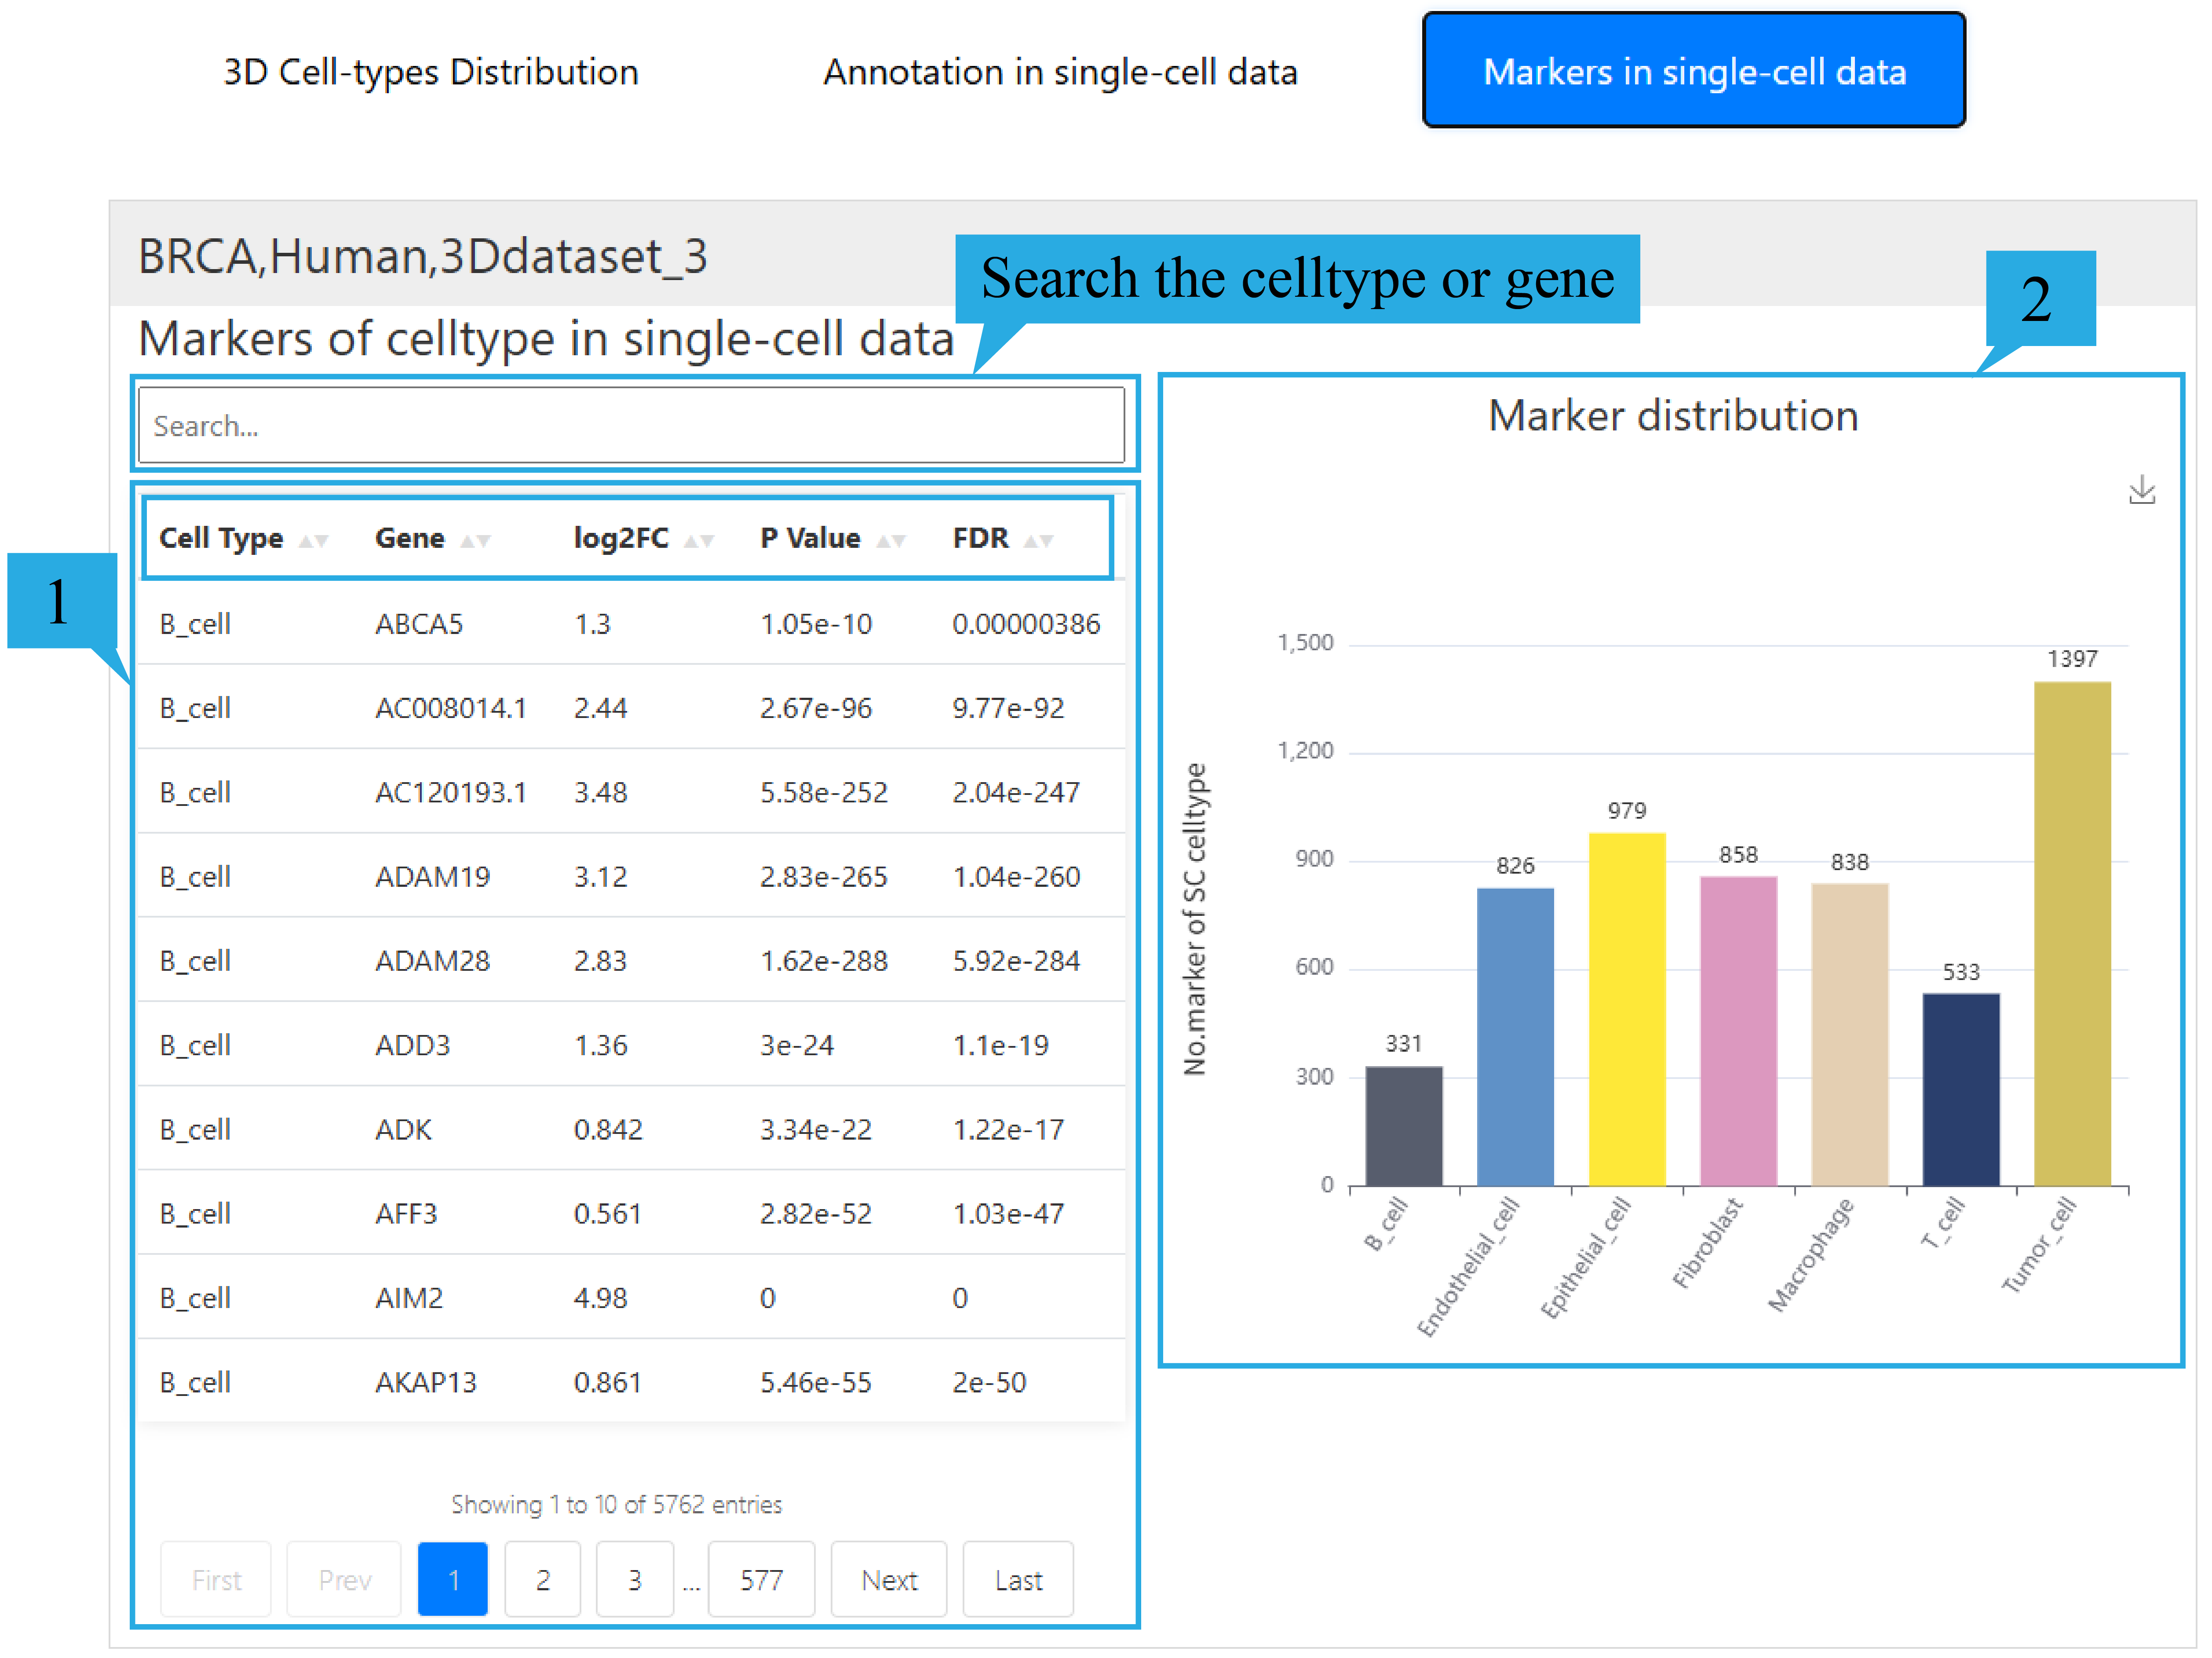
4) “Markers in single-cell data”page:
1.The list presents the genetic information of differentially expressed genes in single-cell data, including Cell type name, Gene name, log2FC, P-value, and FDR. Click on the text can sort the list based on the content of that column. Users can view the relevant information of their differential genes by entering the cell types they are interested in in the search box. At the same time, users can check whether the gene they are interested in is a differential gene and related information by entering it in the search box.
2. The histogram shows the number of differentially expressed genes in different cell types in single-cell data.
Users can explore gene expression patterns across 3D spatial domain as well as the enriched spatial domains and celltypes.
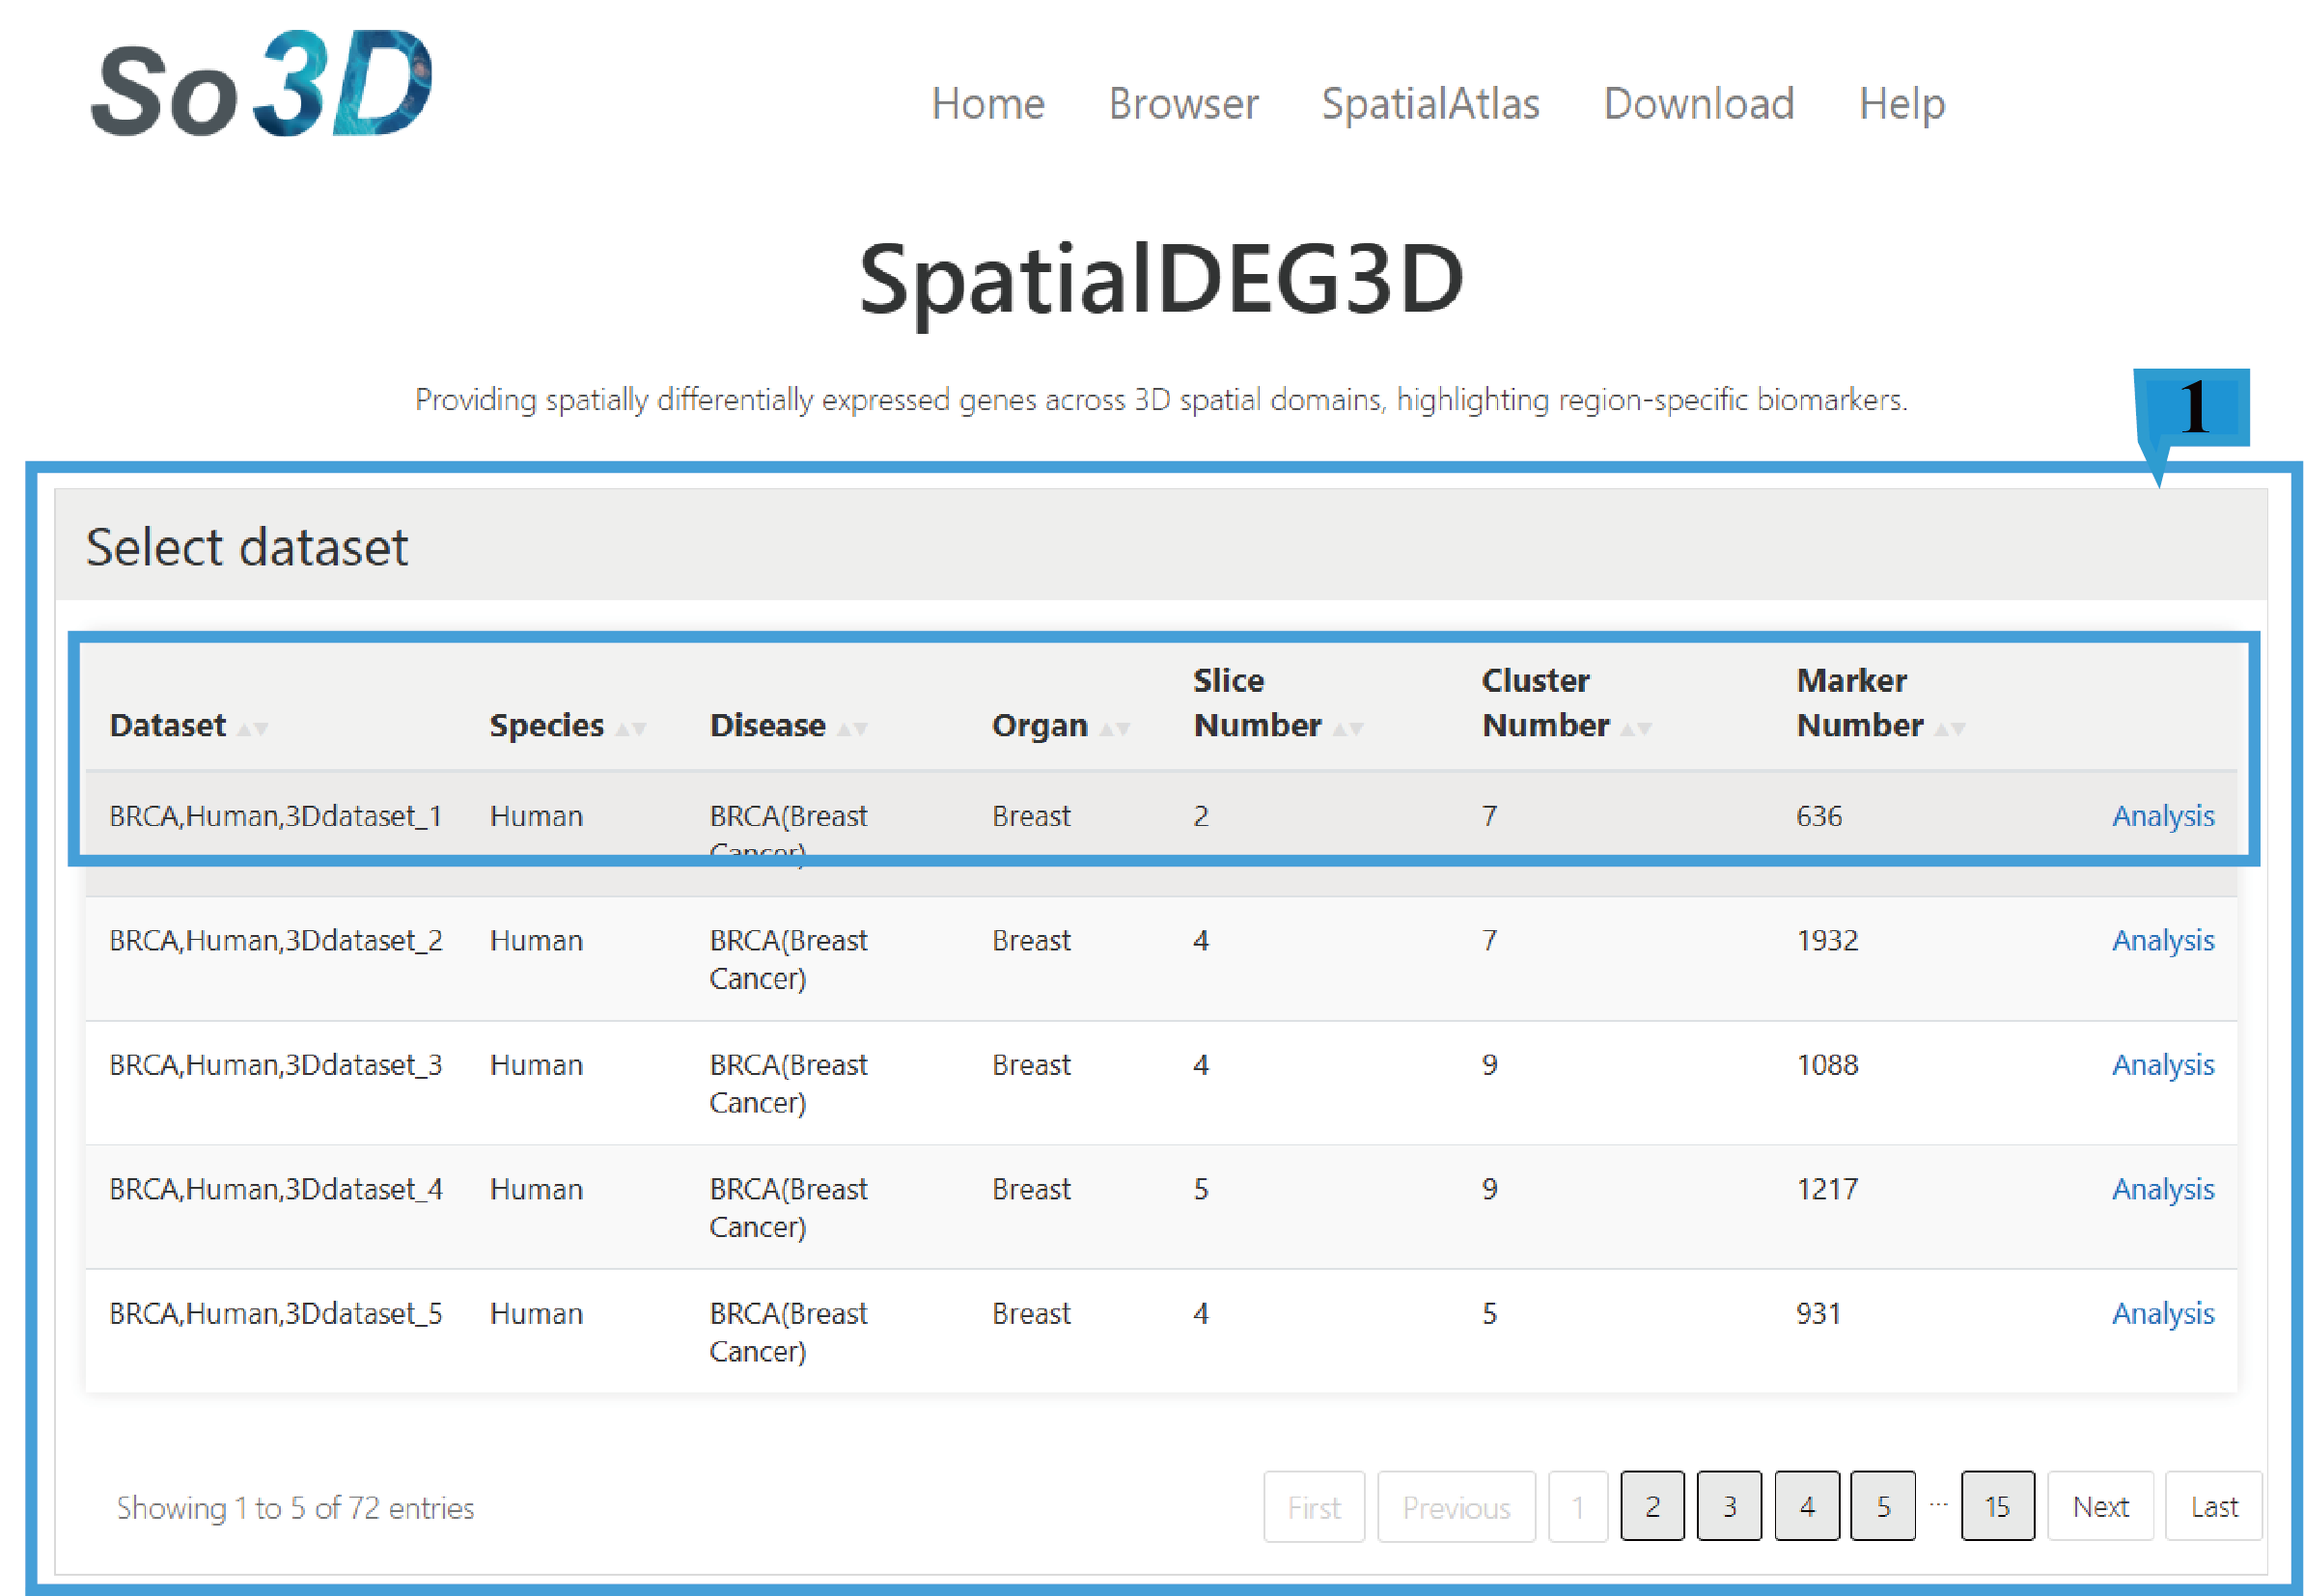
1)Select dataset page:
This function provides an overview of 72 datasets, including Dataset ID, Species, Disease, Organ, Technology, Slice Number, Cluster Number and Marker Number, Click the arrow next to the text to sort the list based on the content of that column. To analyze regulatory differences between genes, users need to click on the "Analysis" corresponding to the dataset of interest.
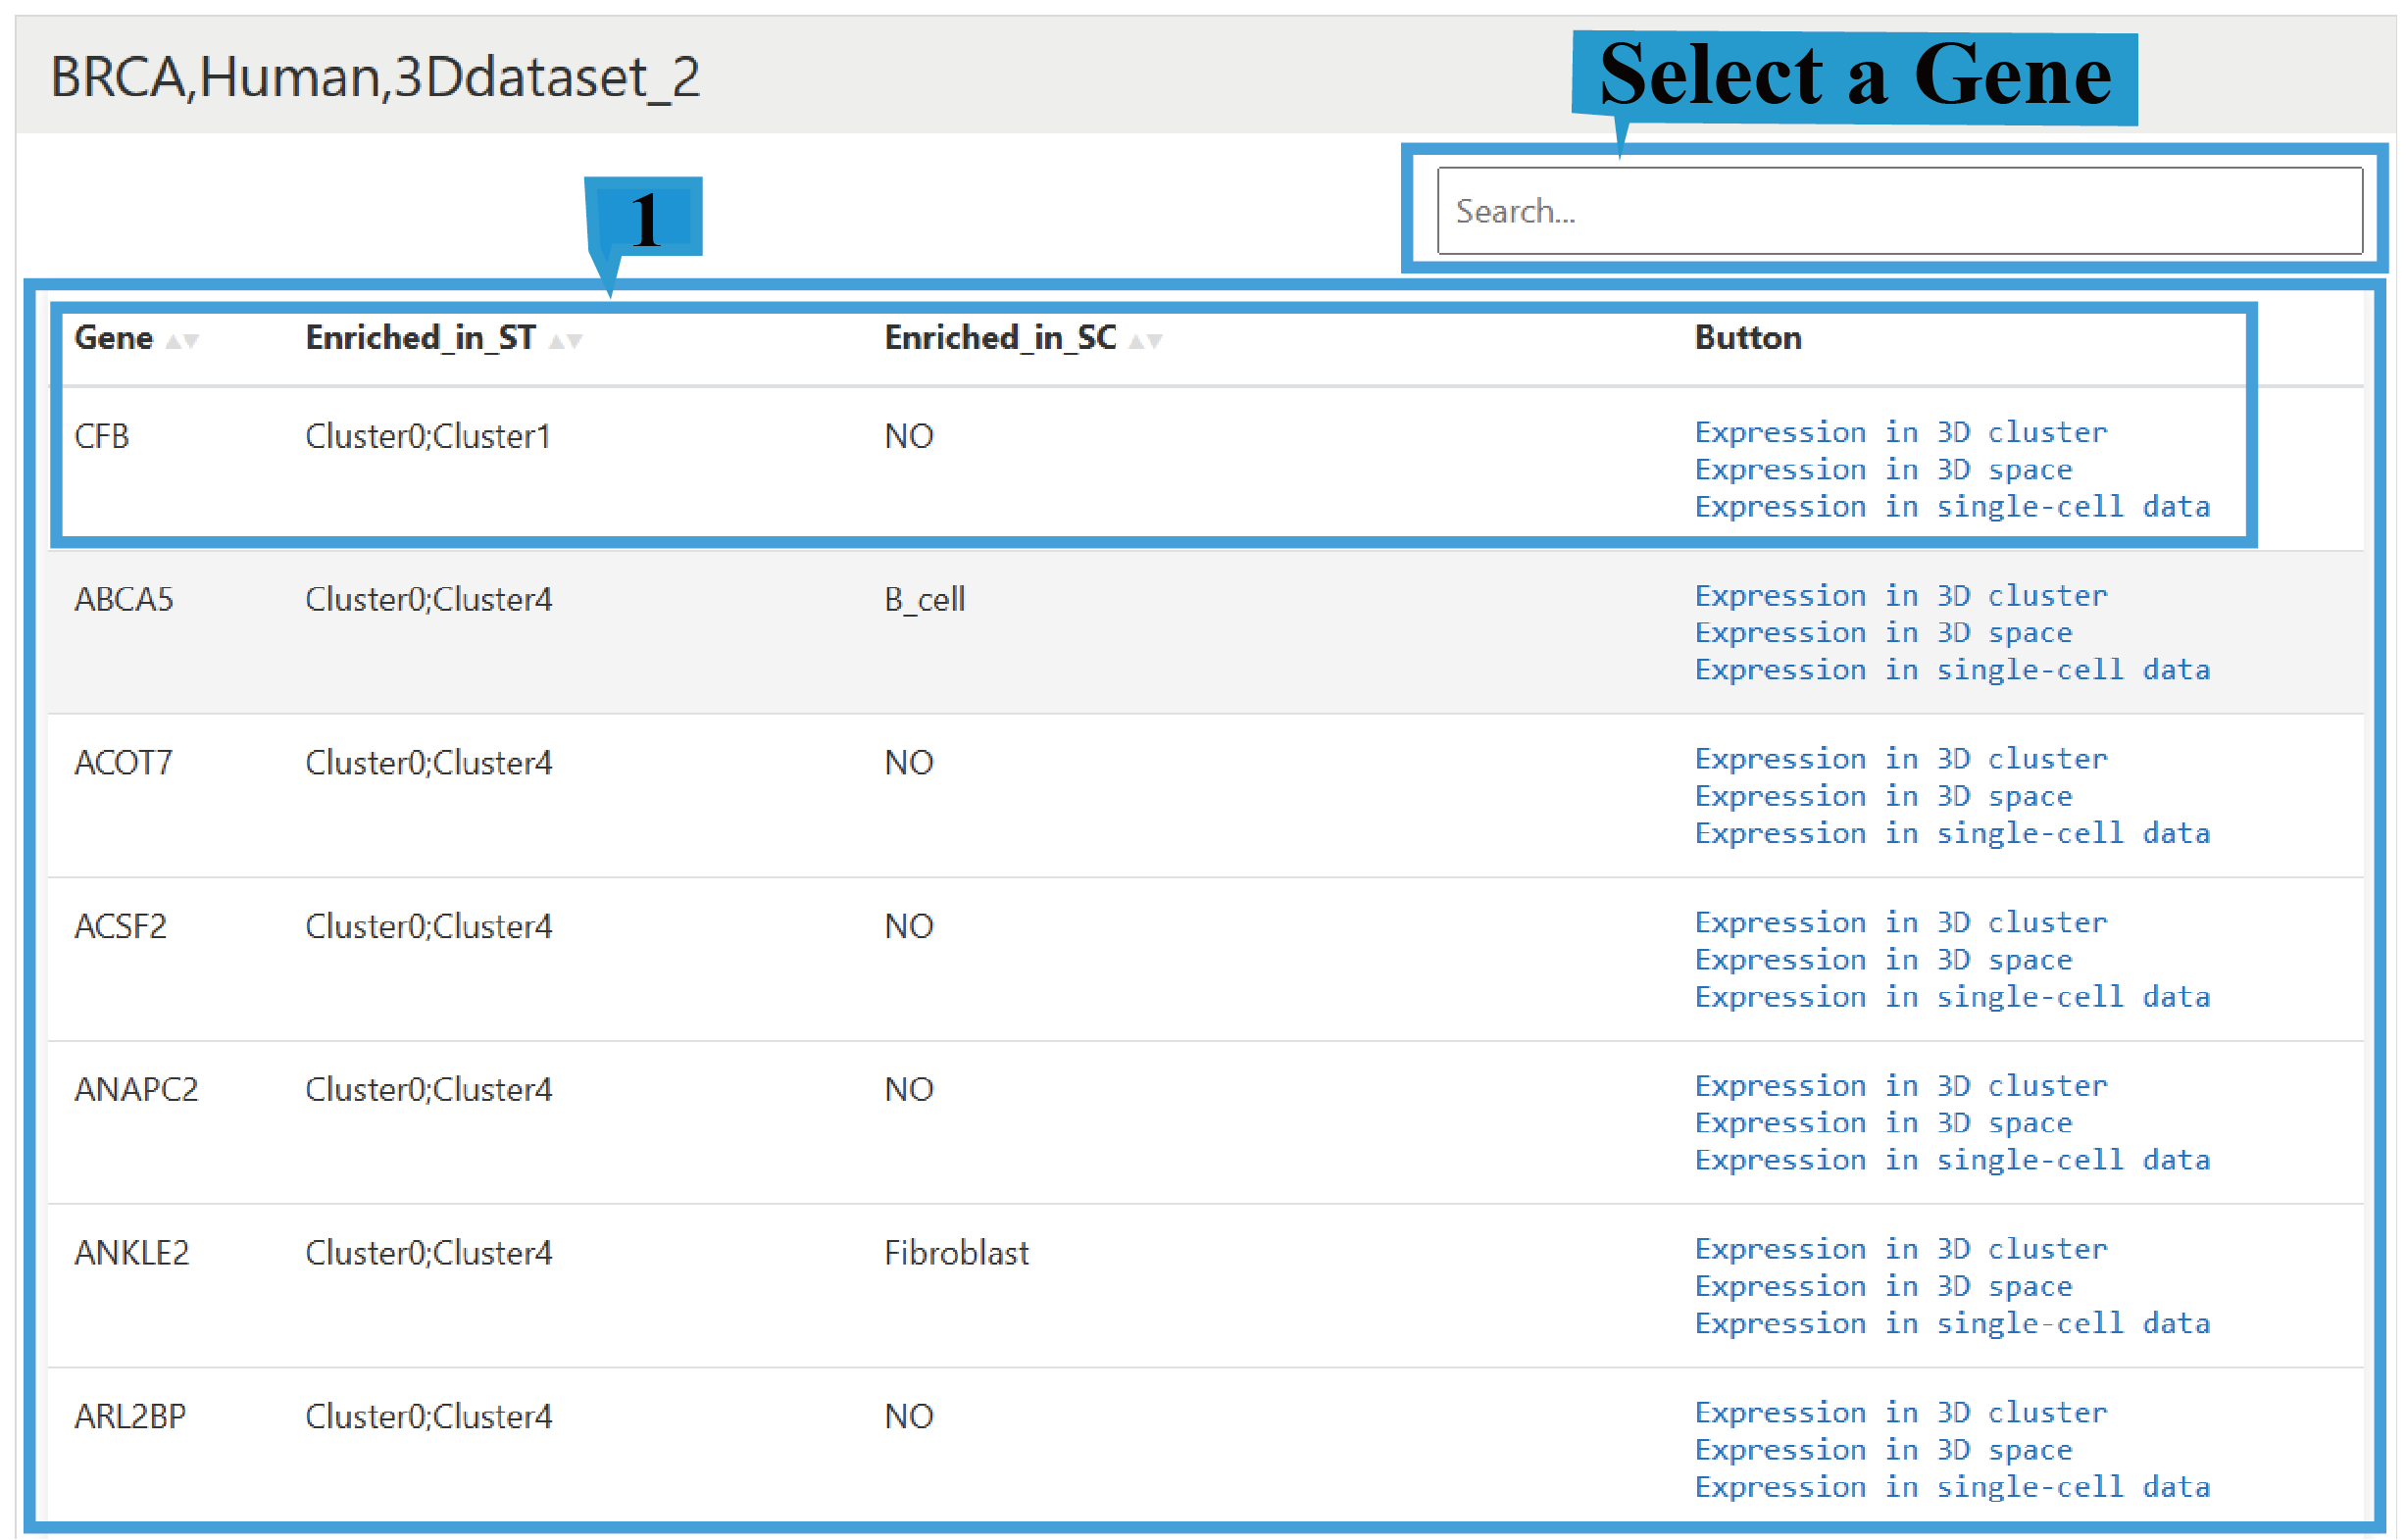
2) Search page:
Users can enter the target gene name in the "Search" field to fuzzy match the corresponding gene. Furthermore, on the gene search page, spatial clusters enriched with the gene and cell types enriched in single-cell data can be viewed (where "NO" indicates no significant enrichment), Click the arrow next to the text to sort the list based on the content of that column.
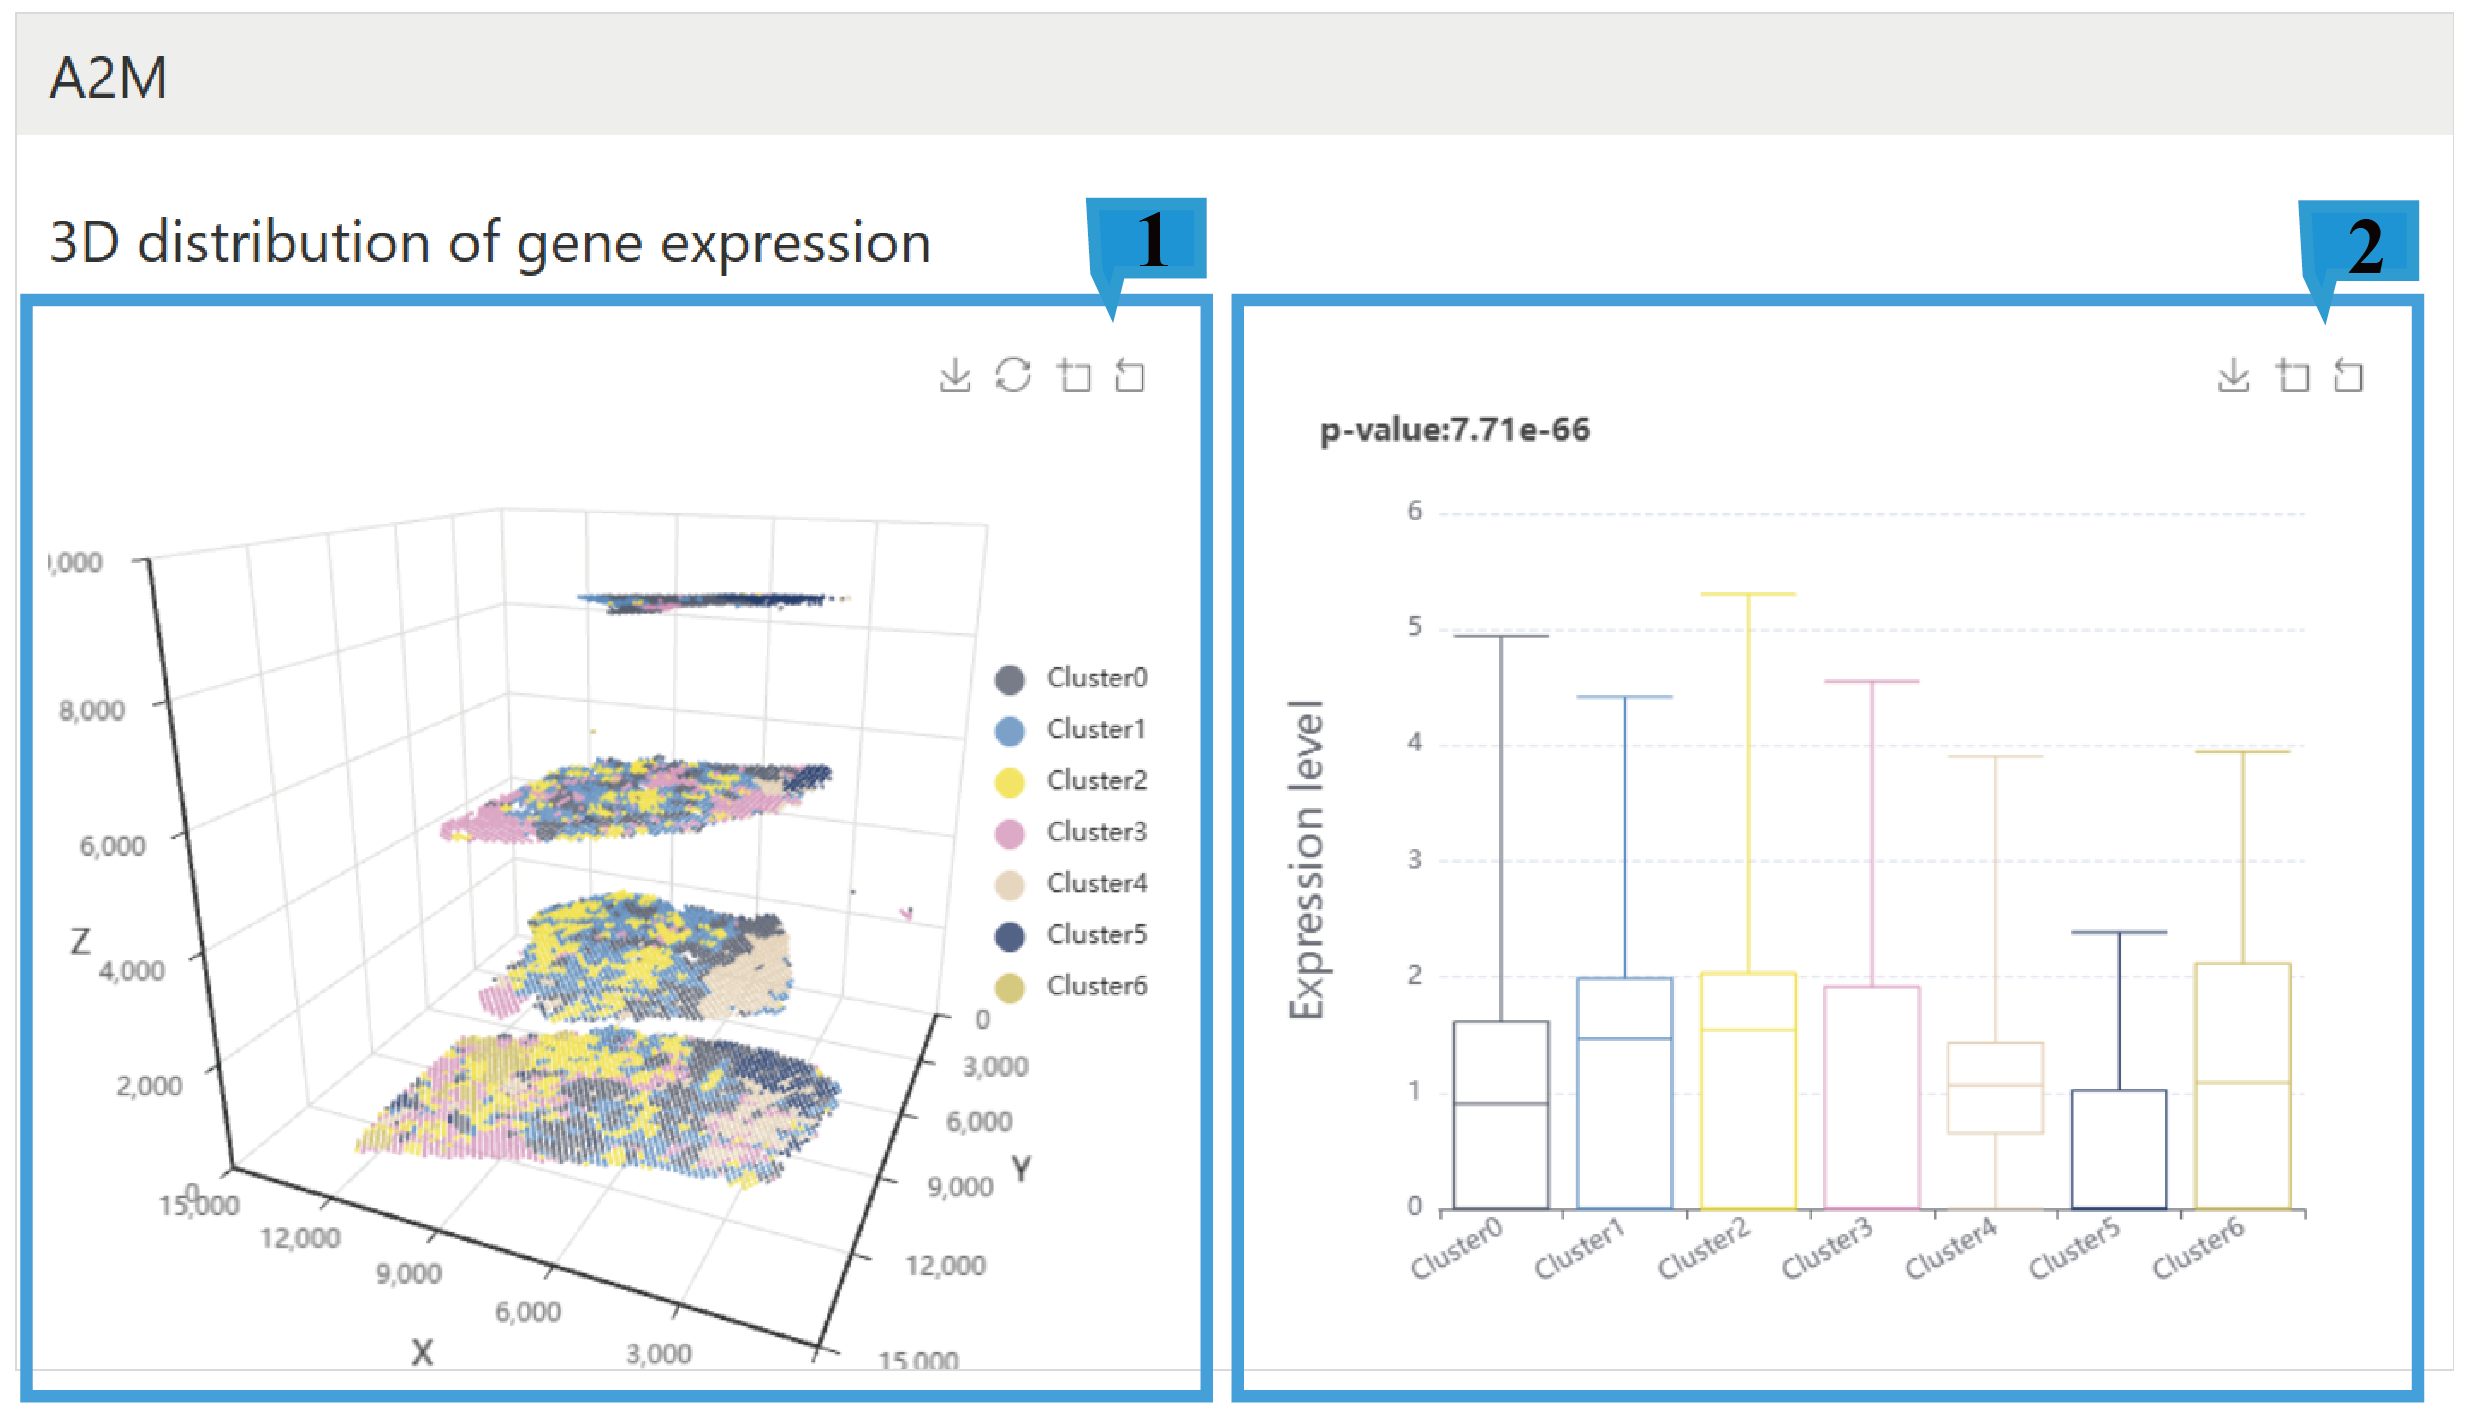
3) “Expression in 3D cluster”page:
1.The 3D gene expression plot shows the spatial distribution of gene expression across different cell clusters in three-dimensional space. Users can rotate the view by dragging the mouse to observe gene expression from various angles. Additionally, users can zoom in and out and save the visualization using the icons located at the top right of the plot. Different colors represent different clusters.
2.The box plot shows the expression levels of genes across different cell clusters. Users can zoom in, zoom out, and save the plot using the icons located at the top right corner. The p-value is provided at the top left corner.
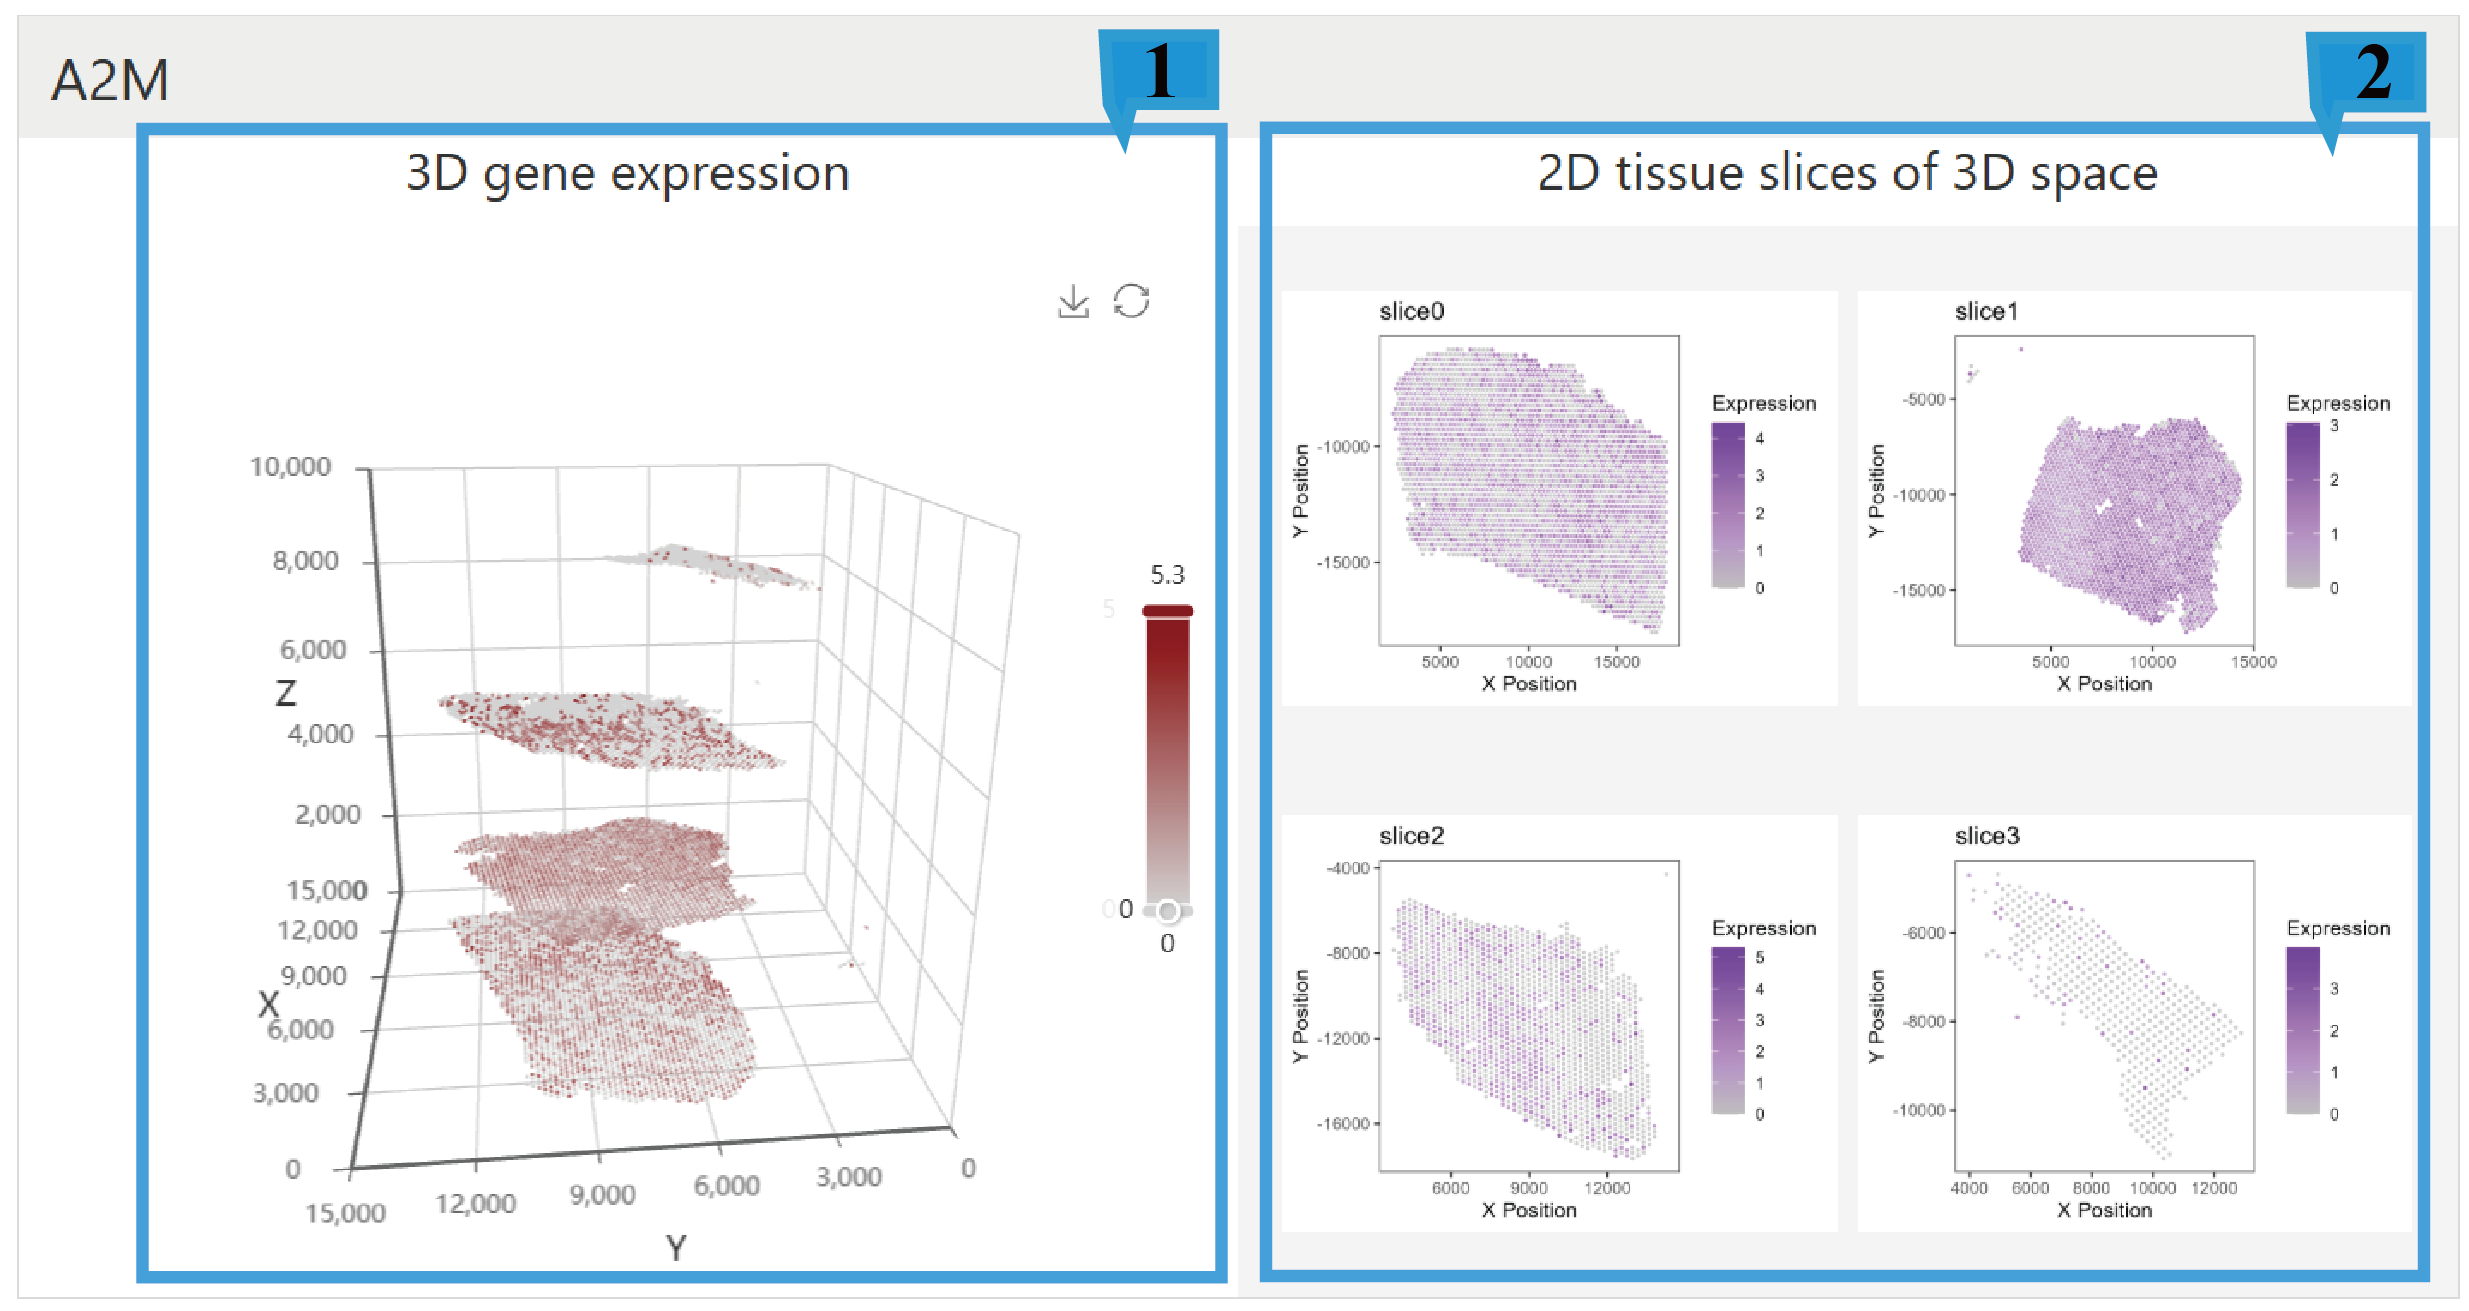
4) “Expression in 3D space”page:
1.The 3D scatter plot shows the expression distribution of a gene in three-dimensional space. Users can rotate the view by dragging the mouse to observe gene expression from different angles, and can also zoom in, zoom out, and save the plot. On the right side of the plot, there is a color bar indicating the level of gene expression, with darker colors representing higher levels of gene expression.
2.The 2D tissue slices of 3D space show the gene expression across different two-dimensional slices within the three-dimensional space. Clicking on the 2D tissue slices allows for zooming in. Each subplot has a color bar on the right side, indicating the level of gene expression, with darker colors representing higher levels of gene expression.
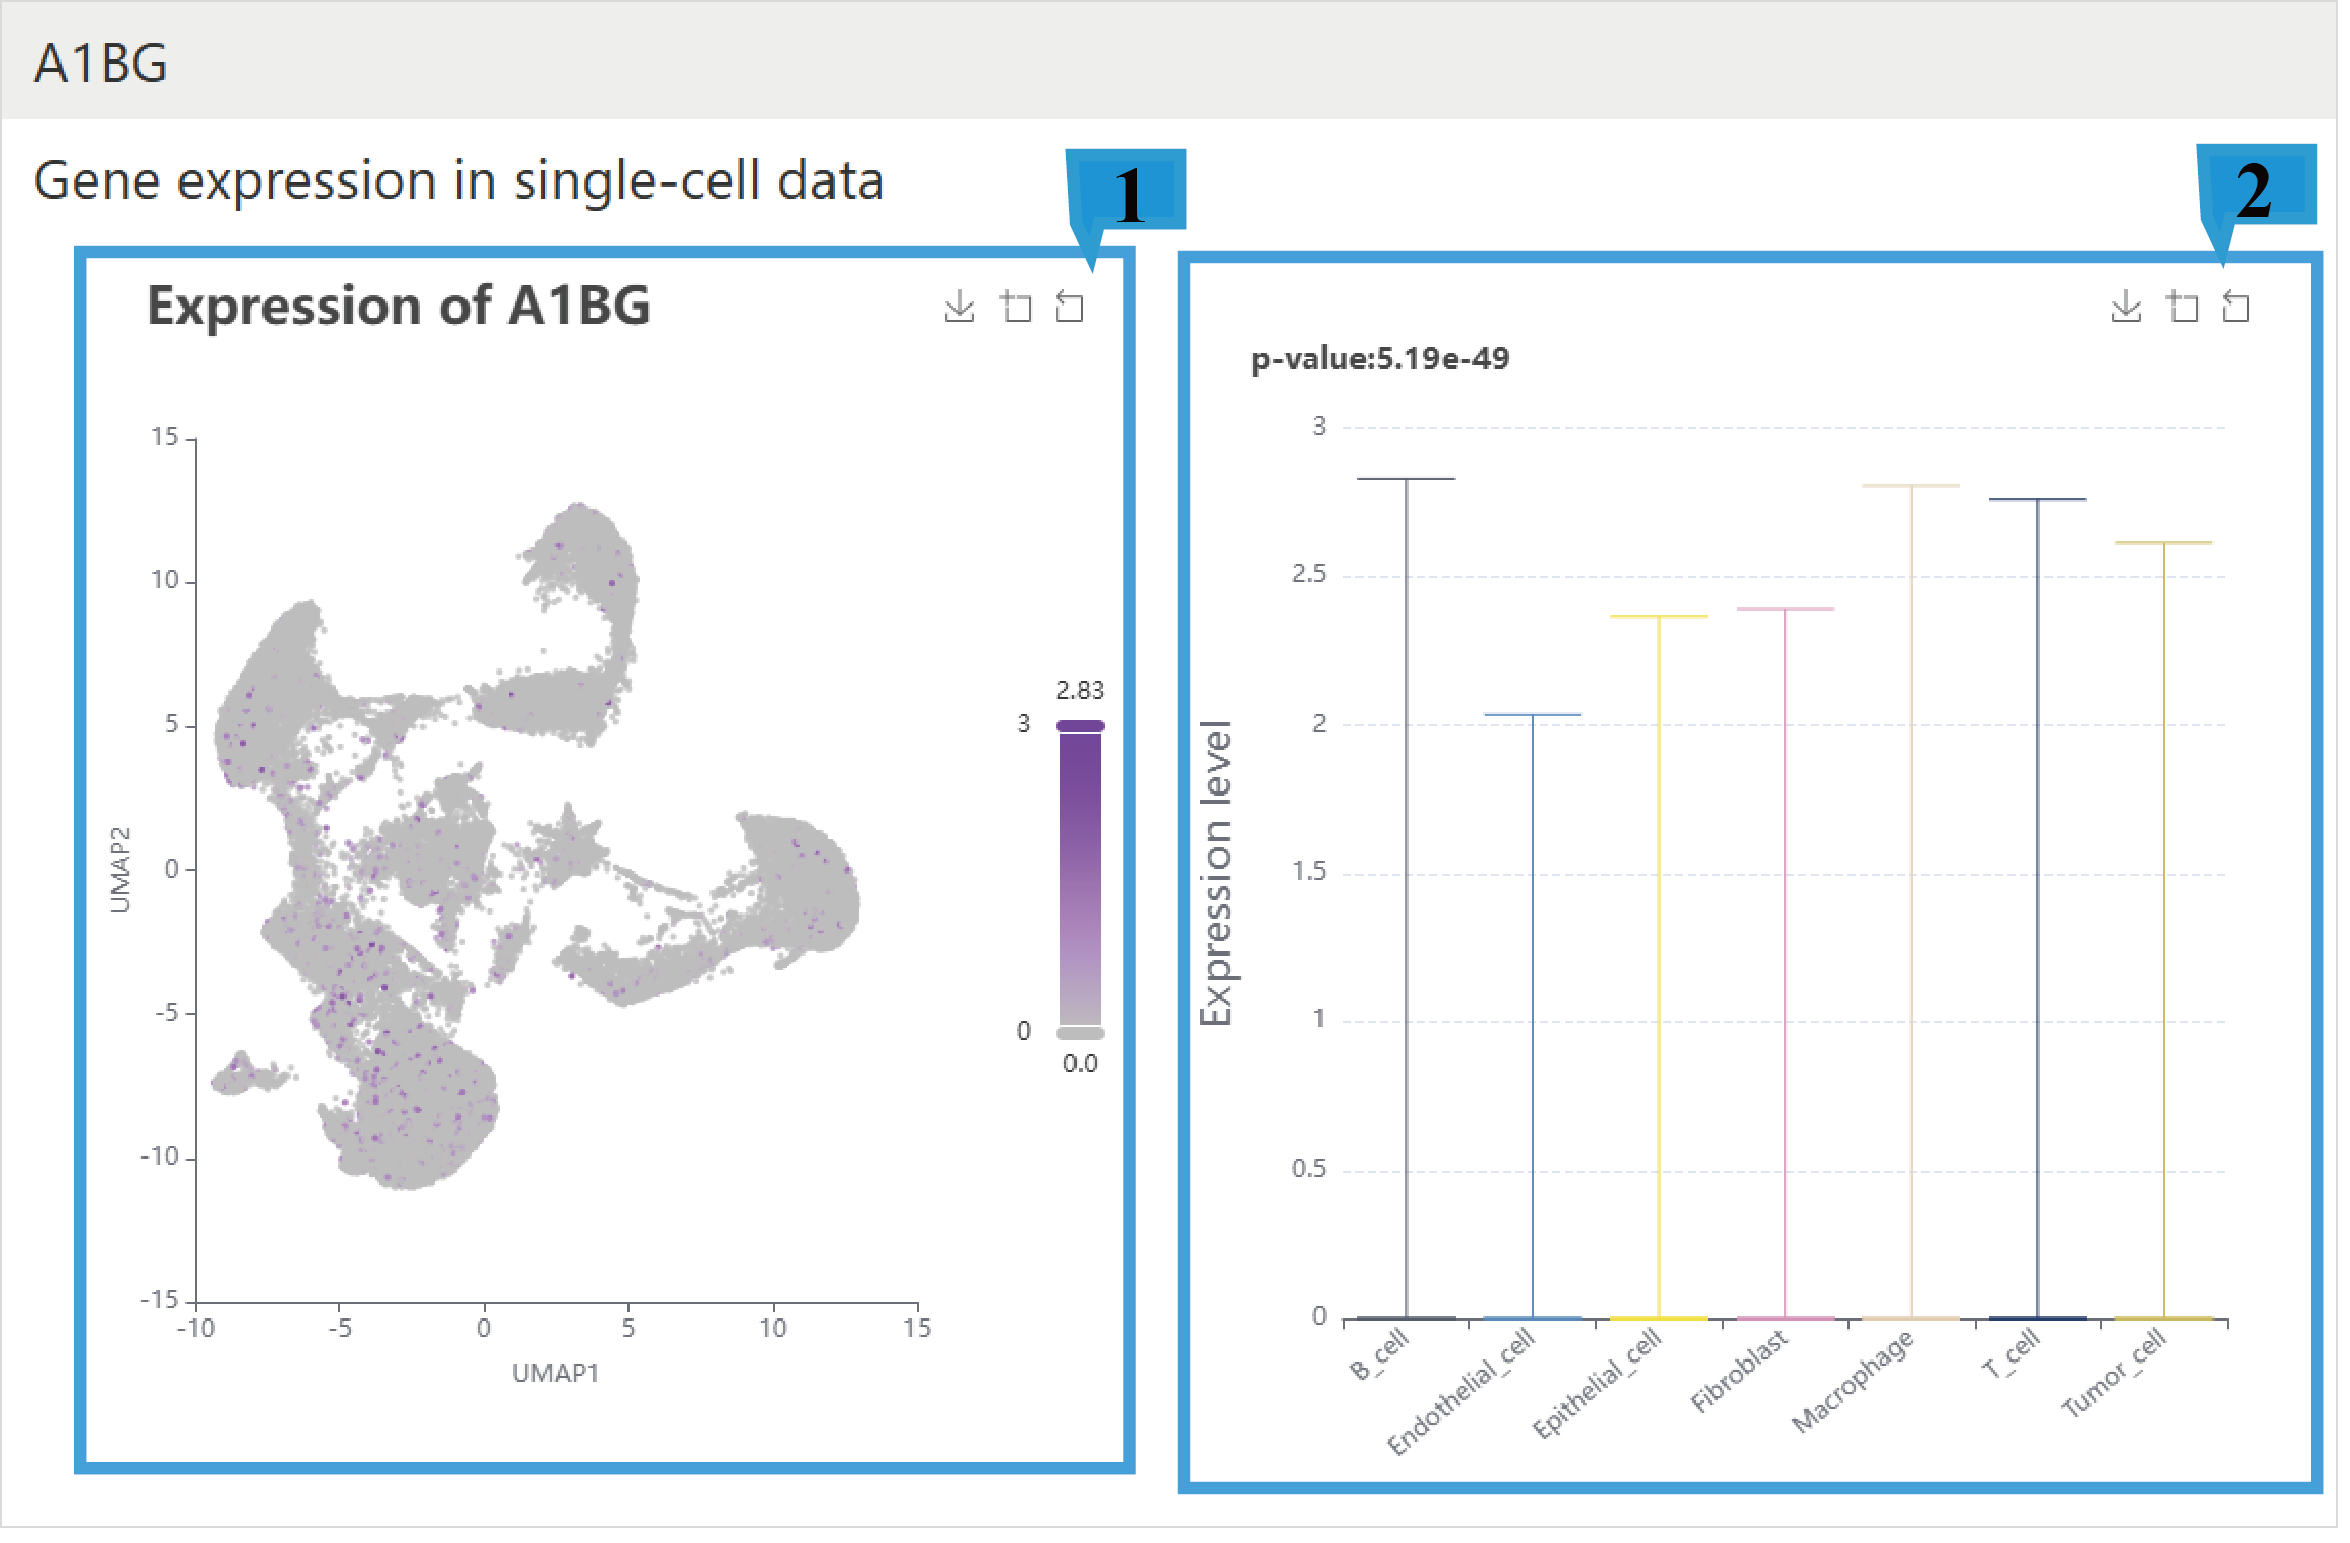
5) “Expression in single-cell data”page:
1.The UMAP plot shows the distribution of gene expression in single-cell data, with the color bar representing the level of gene expression, where darker colors indicate higher levels of gene expression. The top right corner provides options to zoom in or out of areas and to save the visualization.
2.The box plot shows the expression levels of a gene across different cell types. Users can zoom in, zoom out, and save using the icons located at the top right. The top left corner shows the p-value.
Users can explore the potential functions for the celltypes.
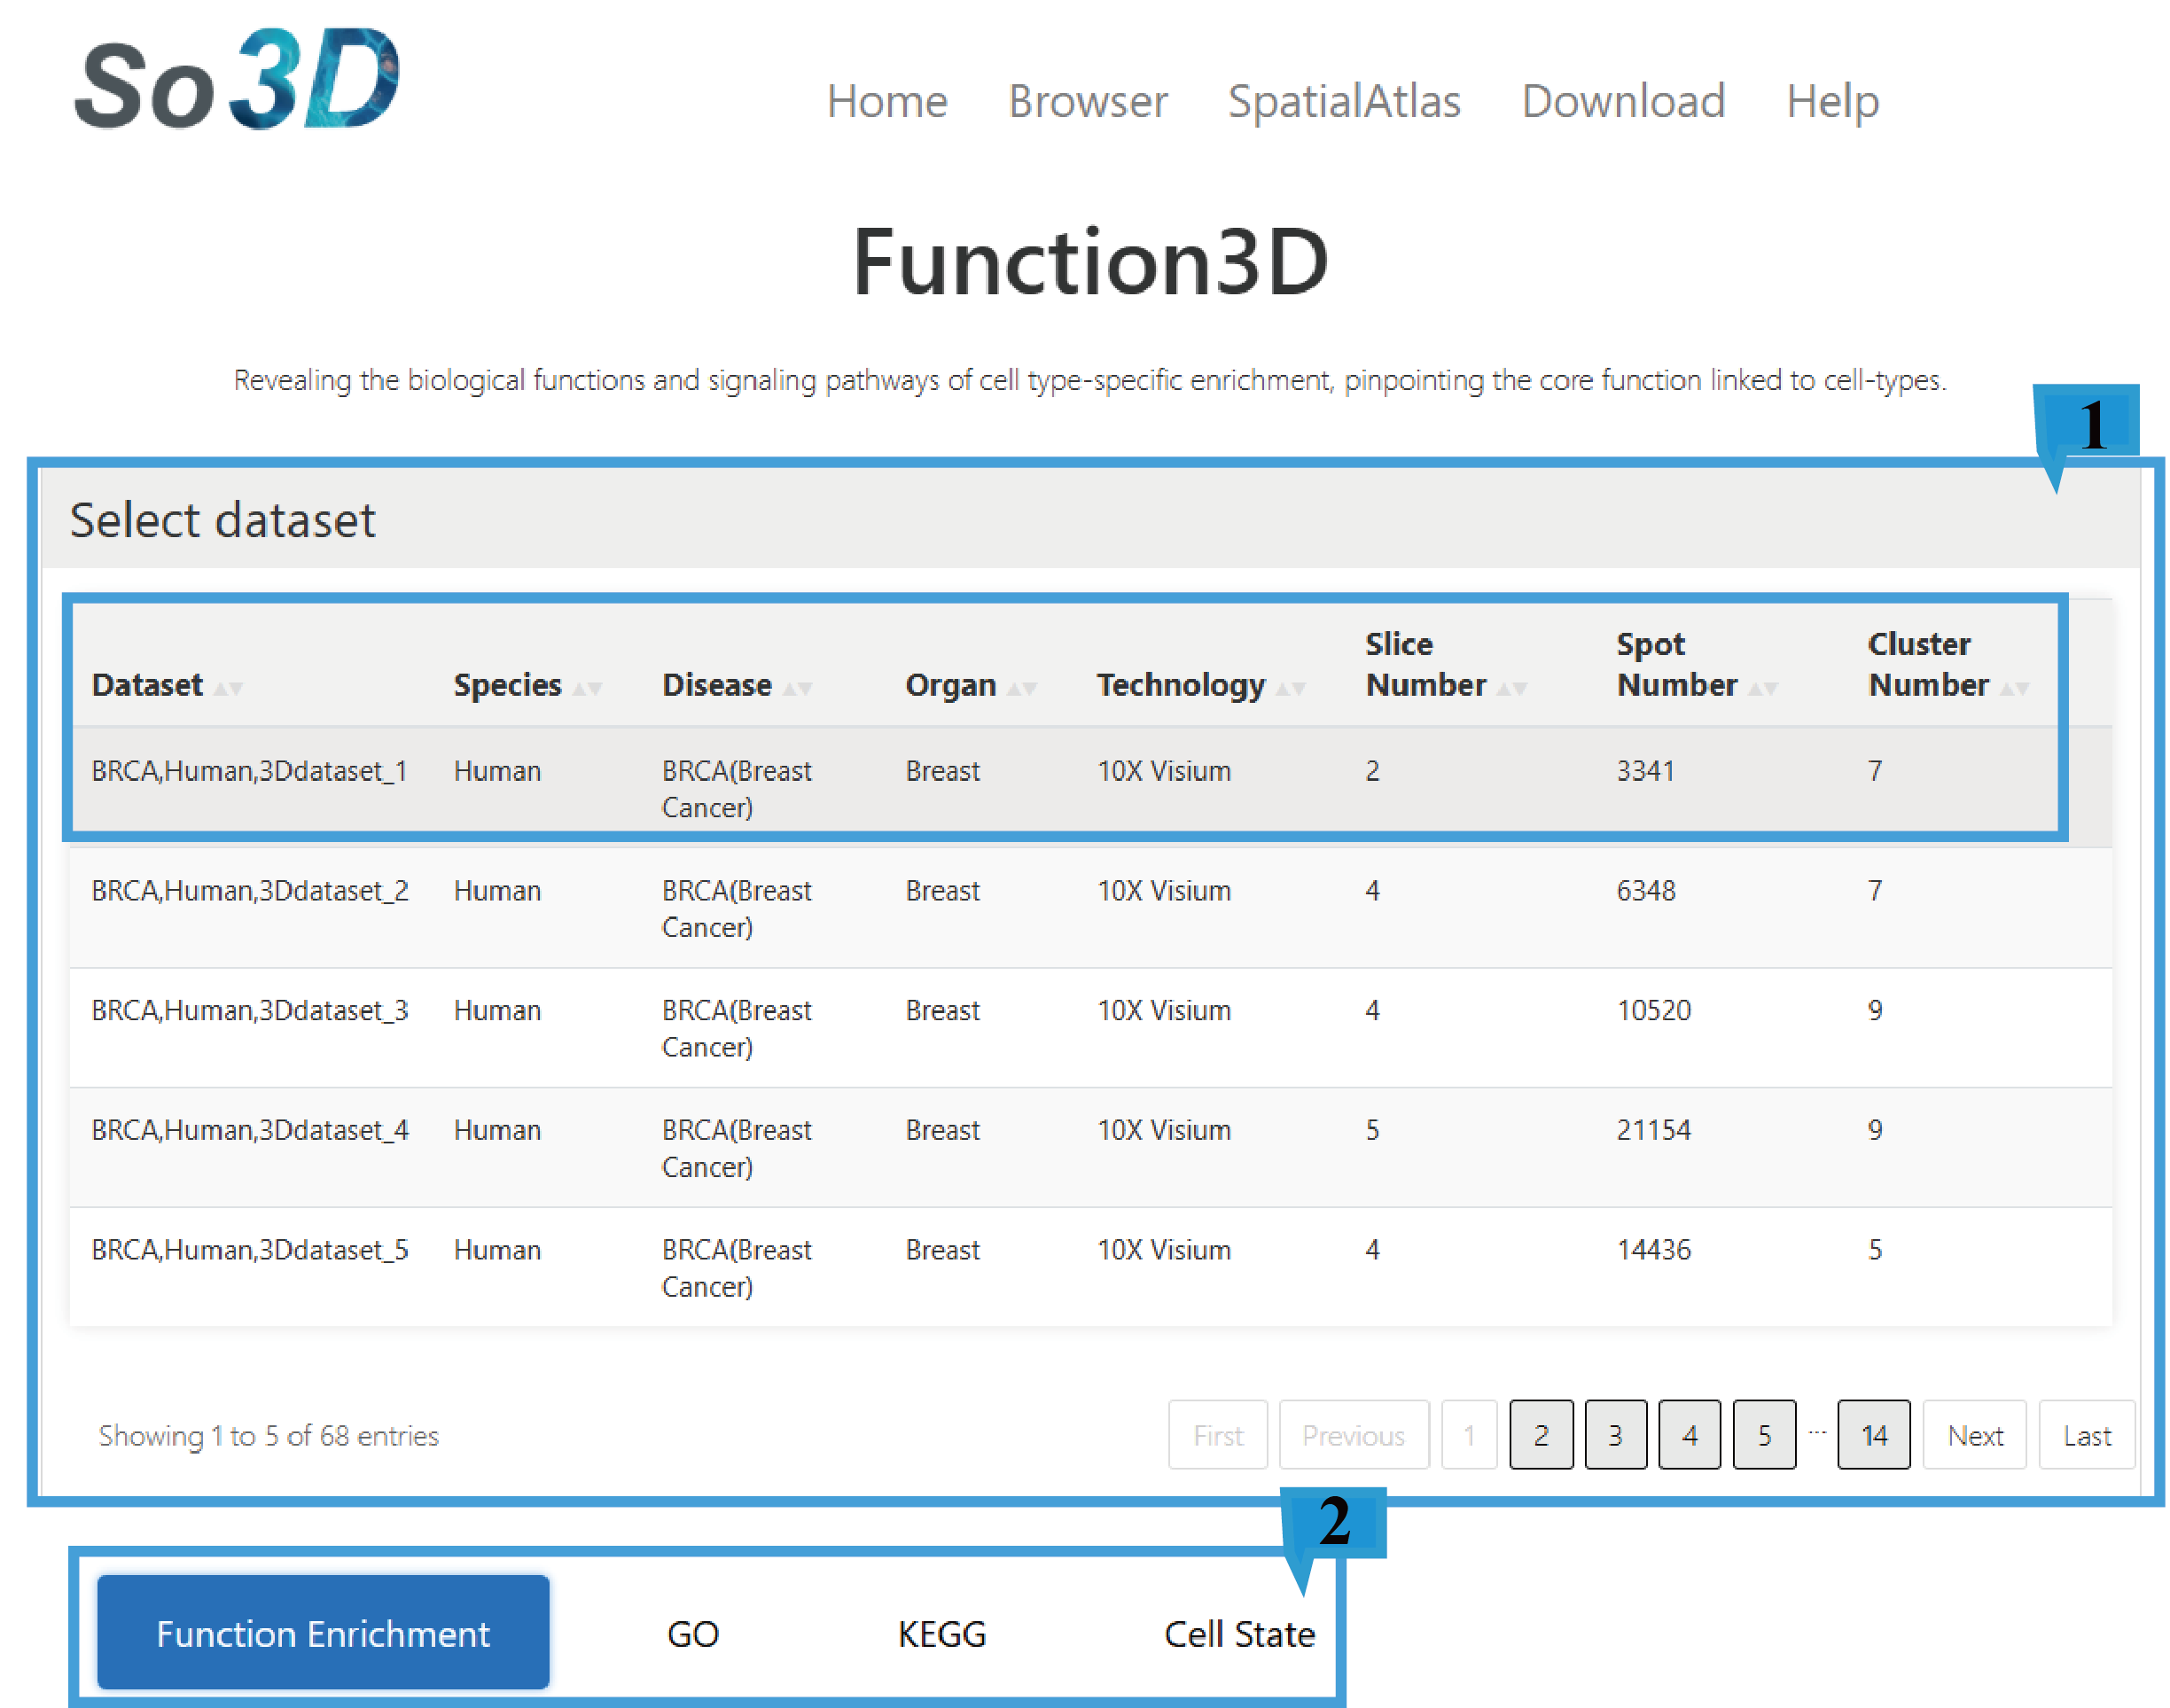
1)Select dataset page:
1.This function provides an overview of 72 datasets, including Dataset ID, Species, Disease, Organ, Technology, Slice Number, Spot Number and Cluster Number, Click the arrow next to the text to sort the list based on the content of that column. Users can select the dataset of interest as needed.
2.Users can select the required type of enrichment analysis, such as "Function Enrichment", "GO", "KEGG" or "Cell State".
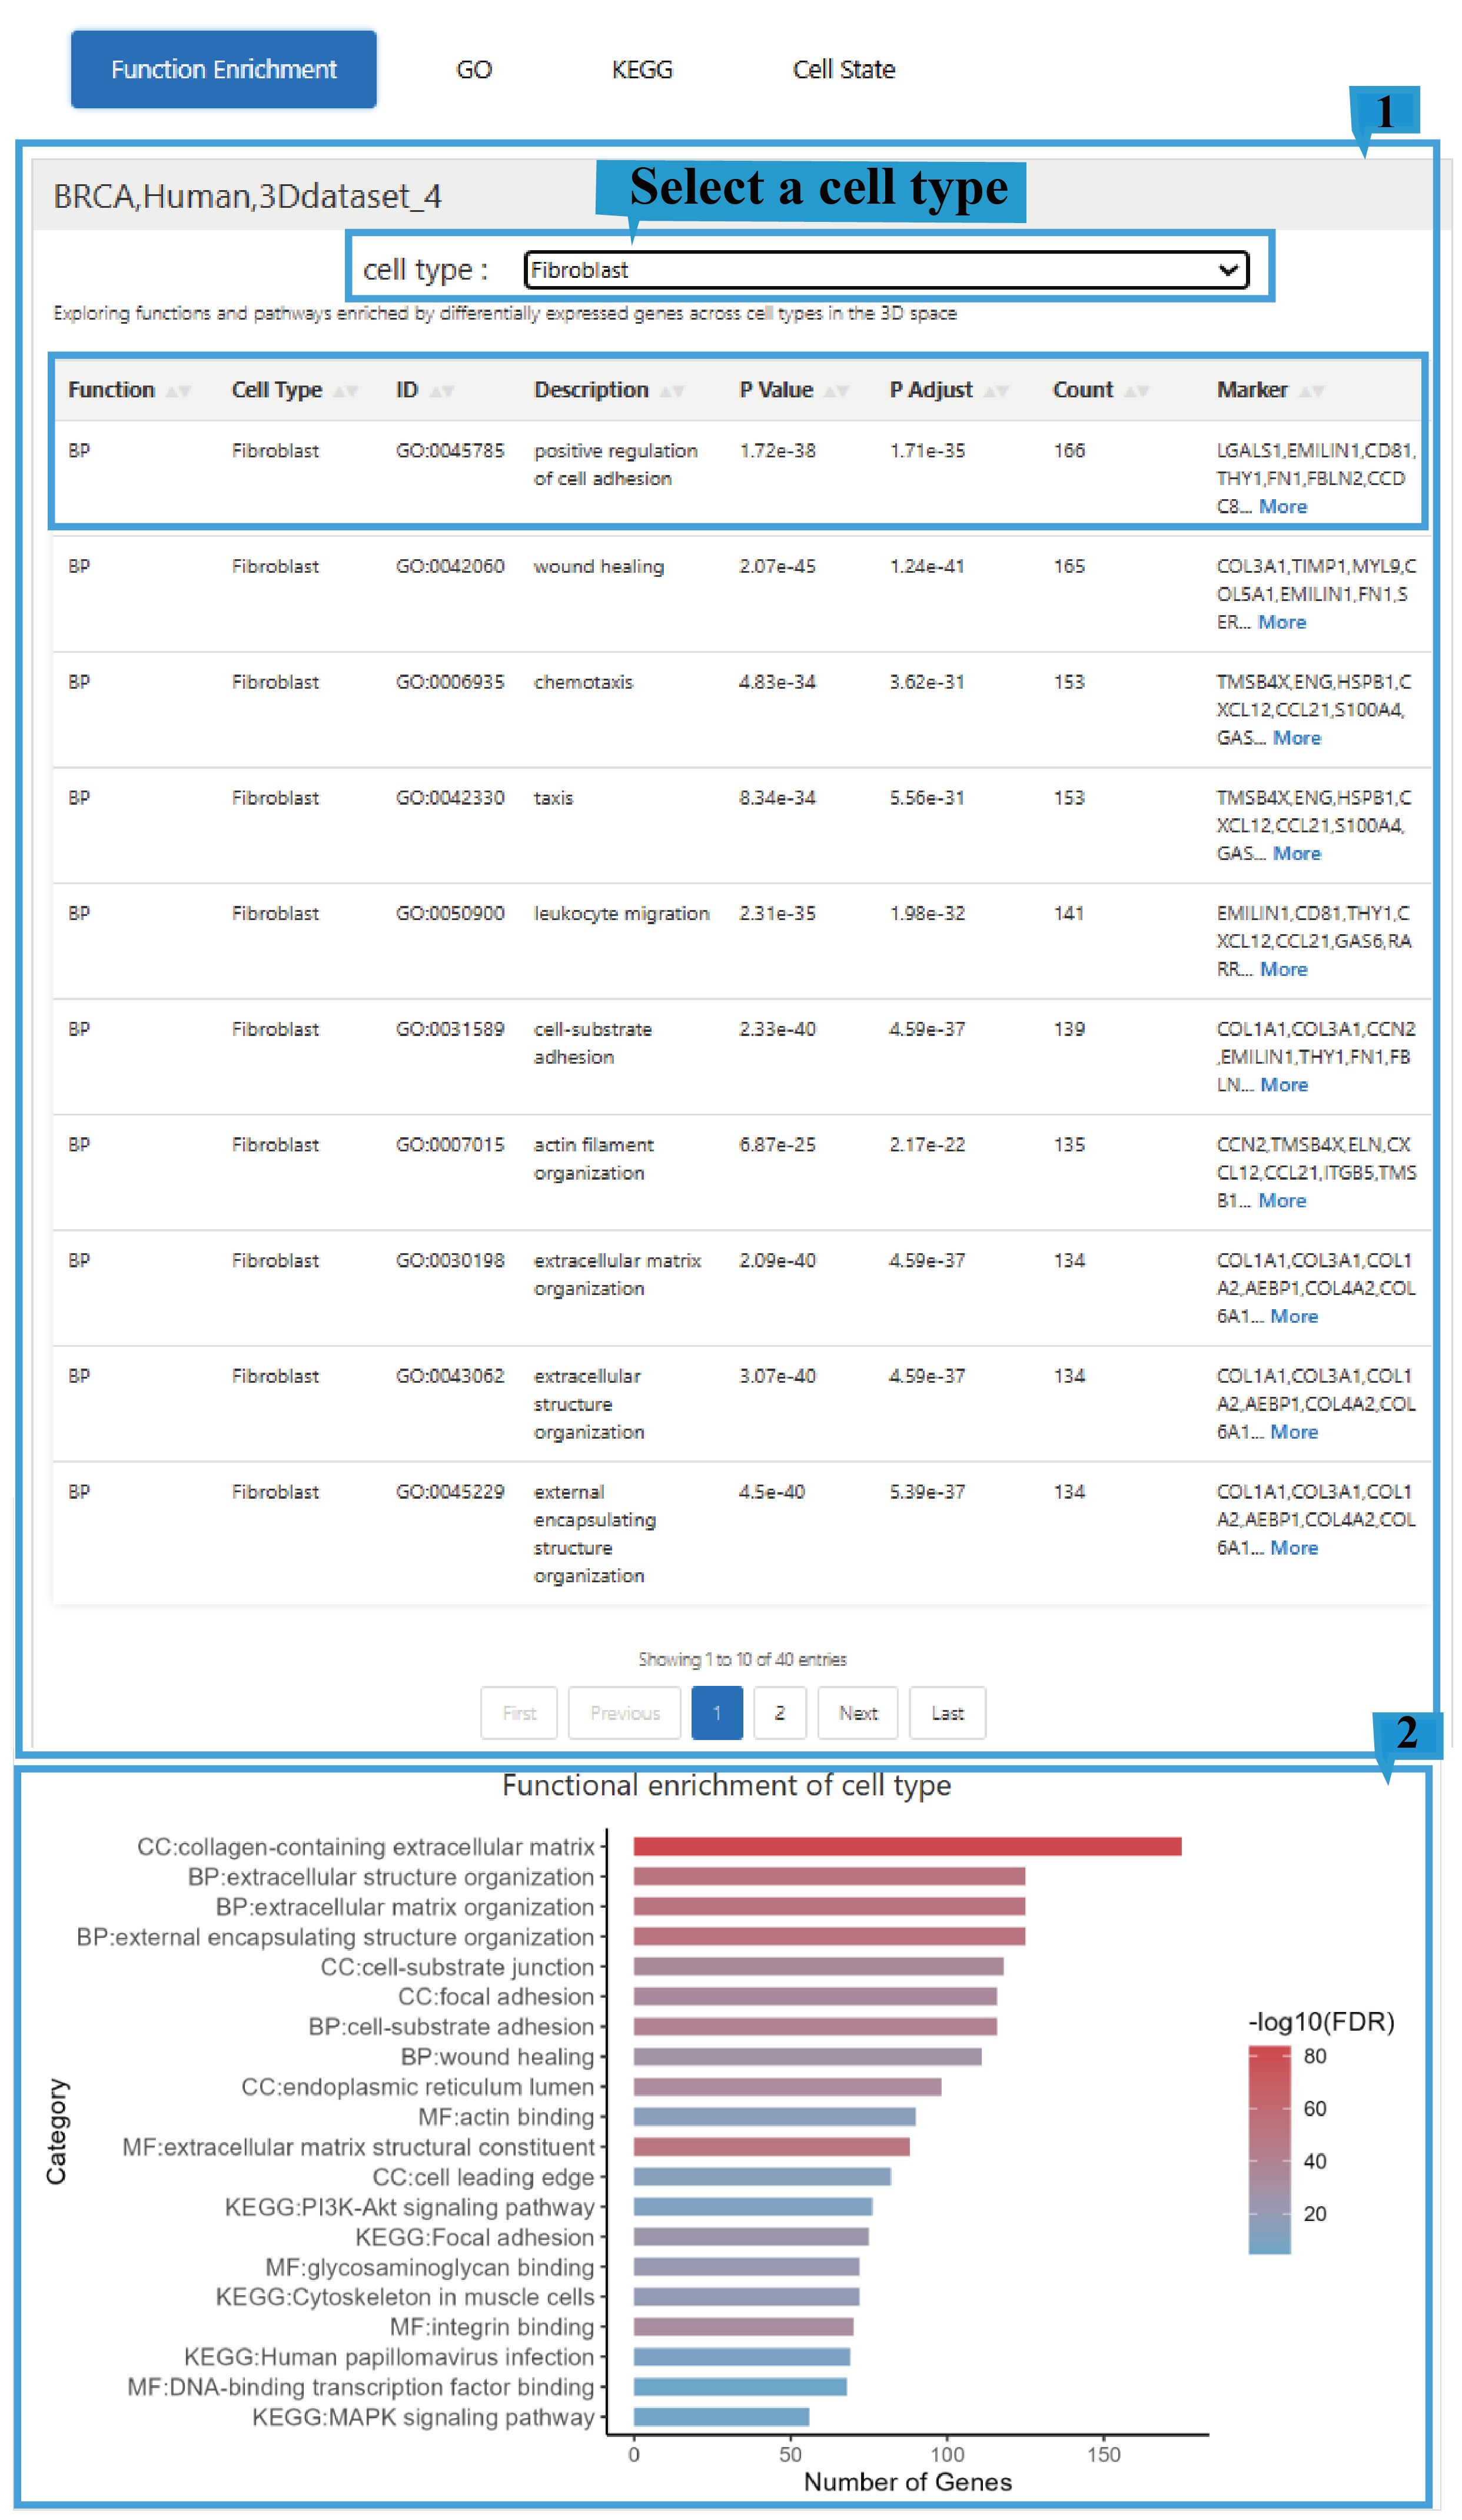
2)“Function Enrichment” page:
1.The Function Enrichment page provides a comprehensive overview of the results, including Function(Biological Process - BP, Cellular Component - CC, Molecular Function - MF),cell types, ID,Description, P-value, the adjusted P-value, the Count of enriched genes, and the list of enriched Marker genes, Click the arrow next to the text to sort the list based on the content of that column. Users can select different cell types to view their corresponding functional enrichment profiles. Click "more" to view the complete list of Marker genes.
2.The column chart shows the results of functional enrichment analysis for cell types. The x-axis indicates the number of genes enriched in specific functions or pathways. Color intensity reflects enrichment significance (-log10(FDR)). Function categories include Biological Process (BP), Cellular Component (CC), and Molecular Function (MF). KEGG pathways show signaling pathways related to specific diseases or biological processes.
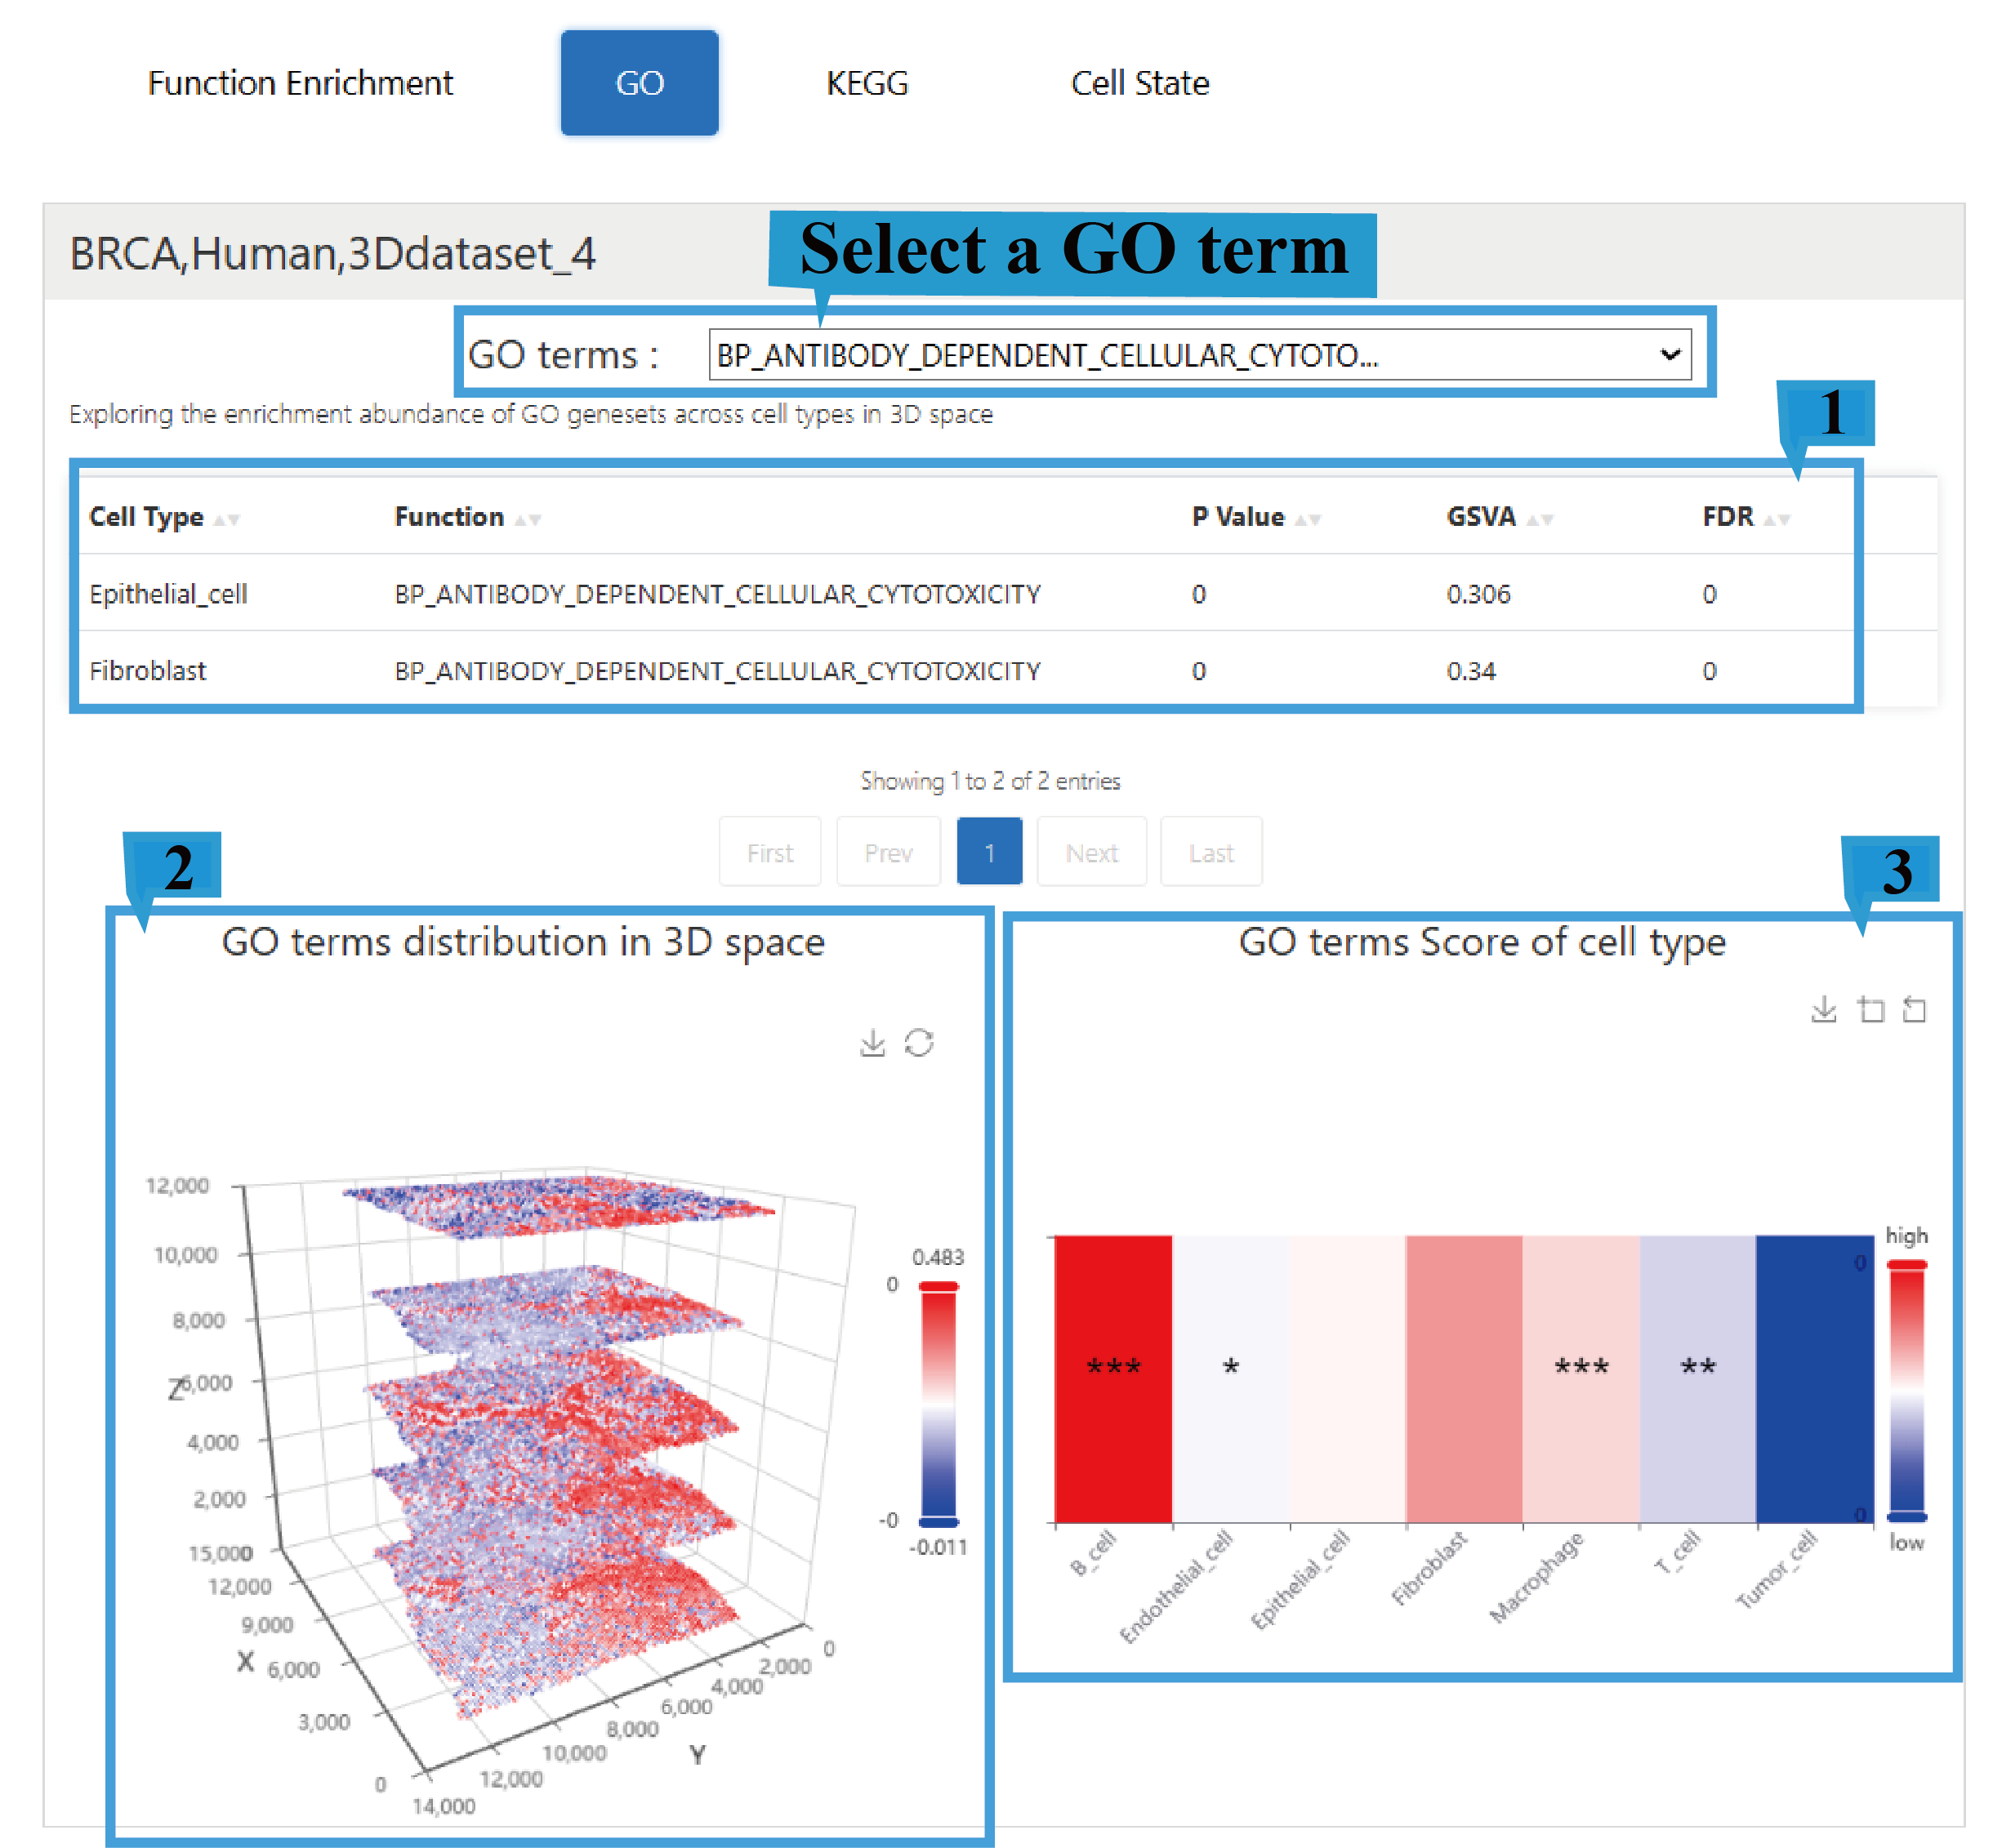
3)“GO” page:
1.The GO page presents a fundamental overview of the results, including enriched cell types, enriched functional categories (BP/CC/MF), P Value, the Gene Set Variation Analysis (GSVA) score, and the adjusted P-value (False Discovery Rate), Click the arrow next to the text to sort the list based on the content of that column; users can select different GO terms to view their corresponding functional enrichment profiles.
2.The graph shows the distribution of enriched GO terms in 3D space and allows users to rotate the view with the mouse for a better perspective.
3.The heatmap shows GO term scores across different cell types, with an asterisk (*) indicating the significance level of a GO term in a specific cell type.
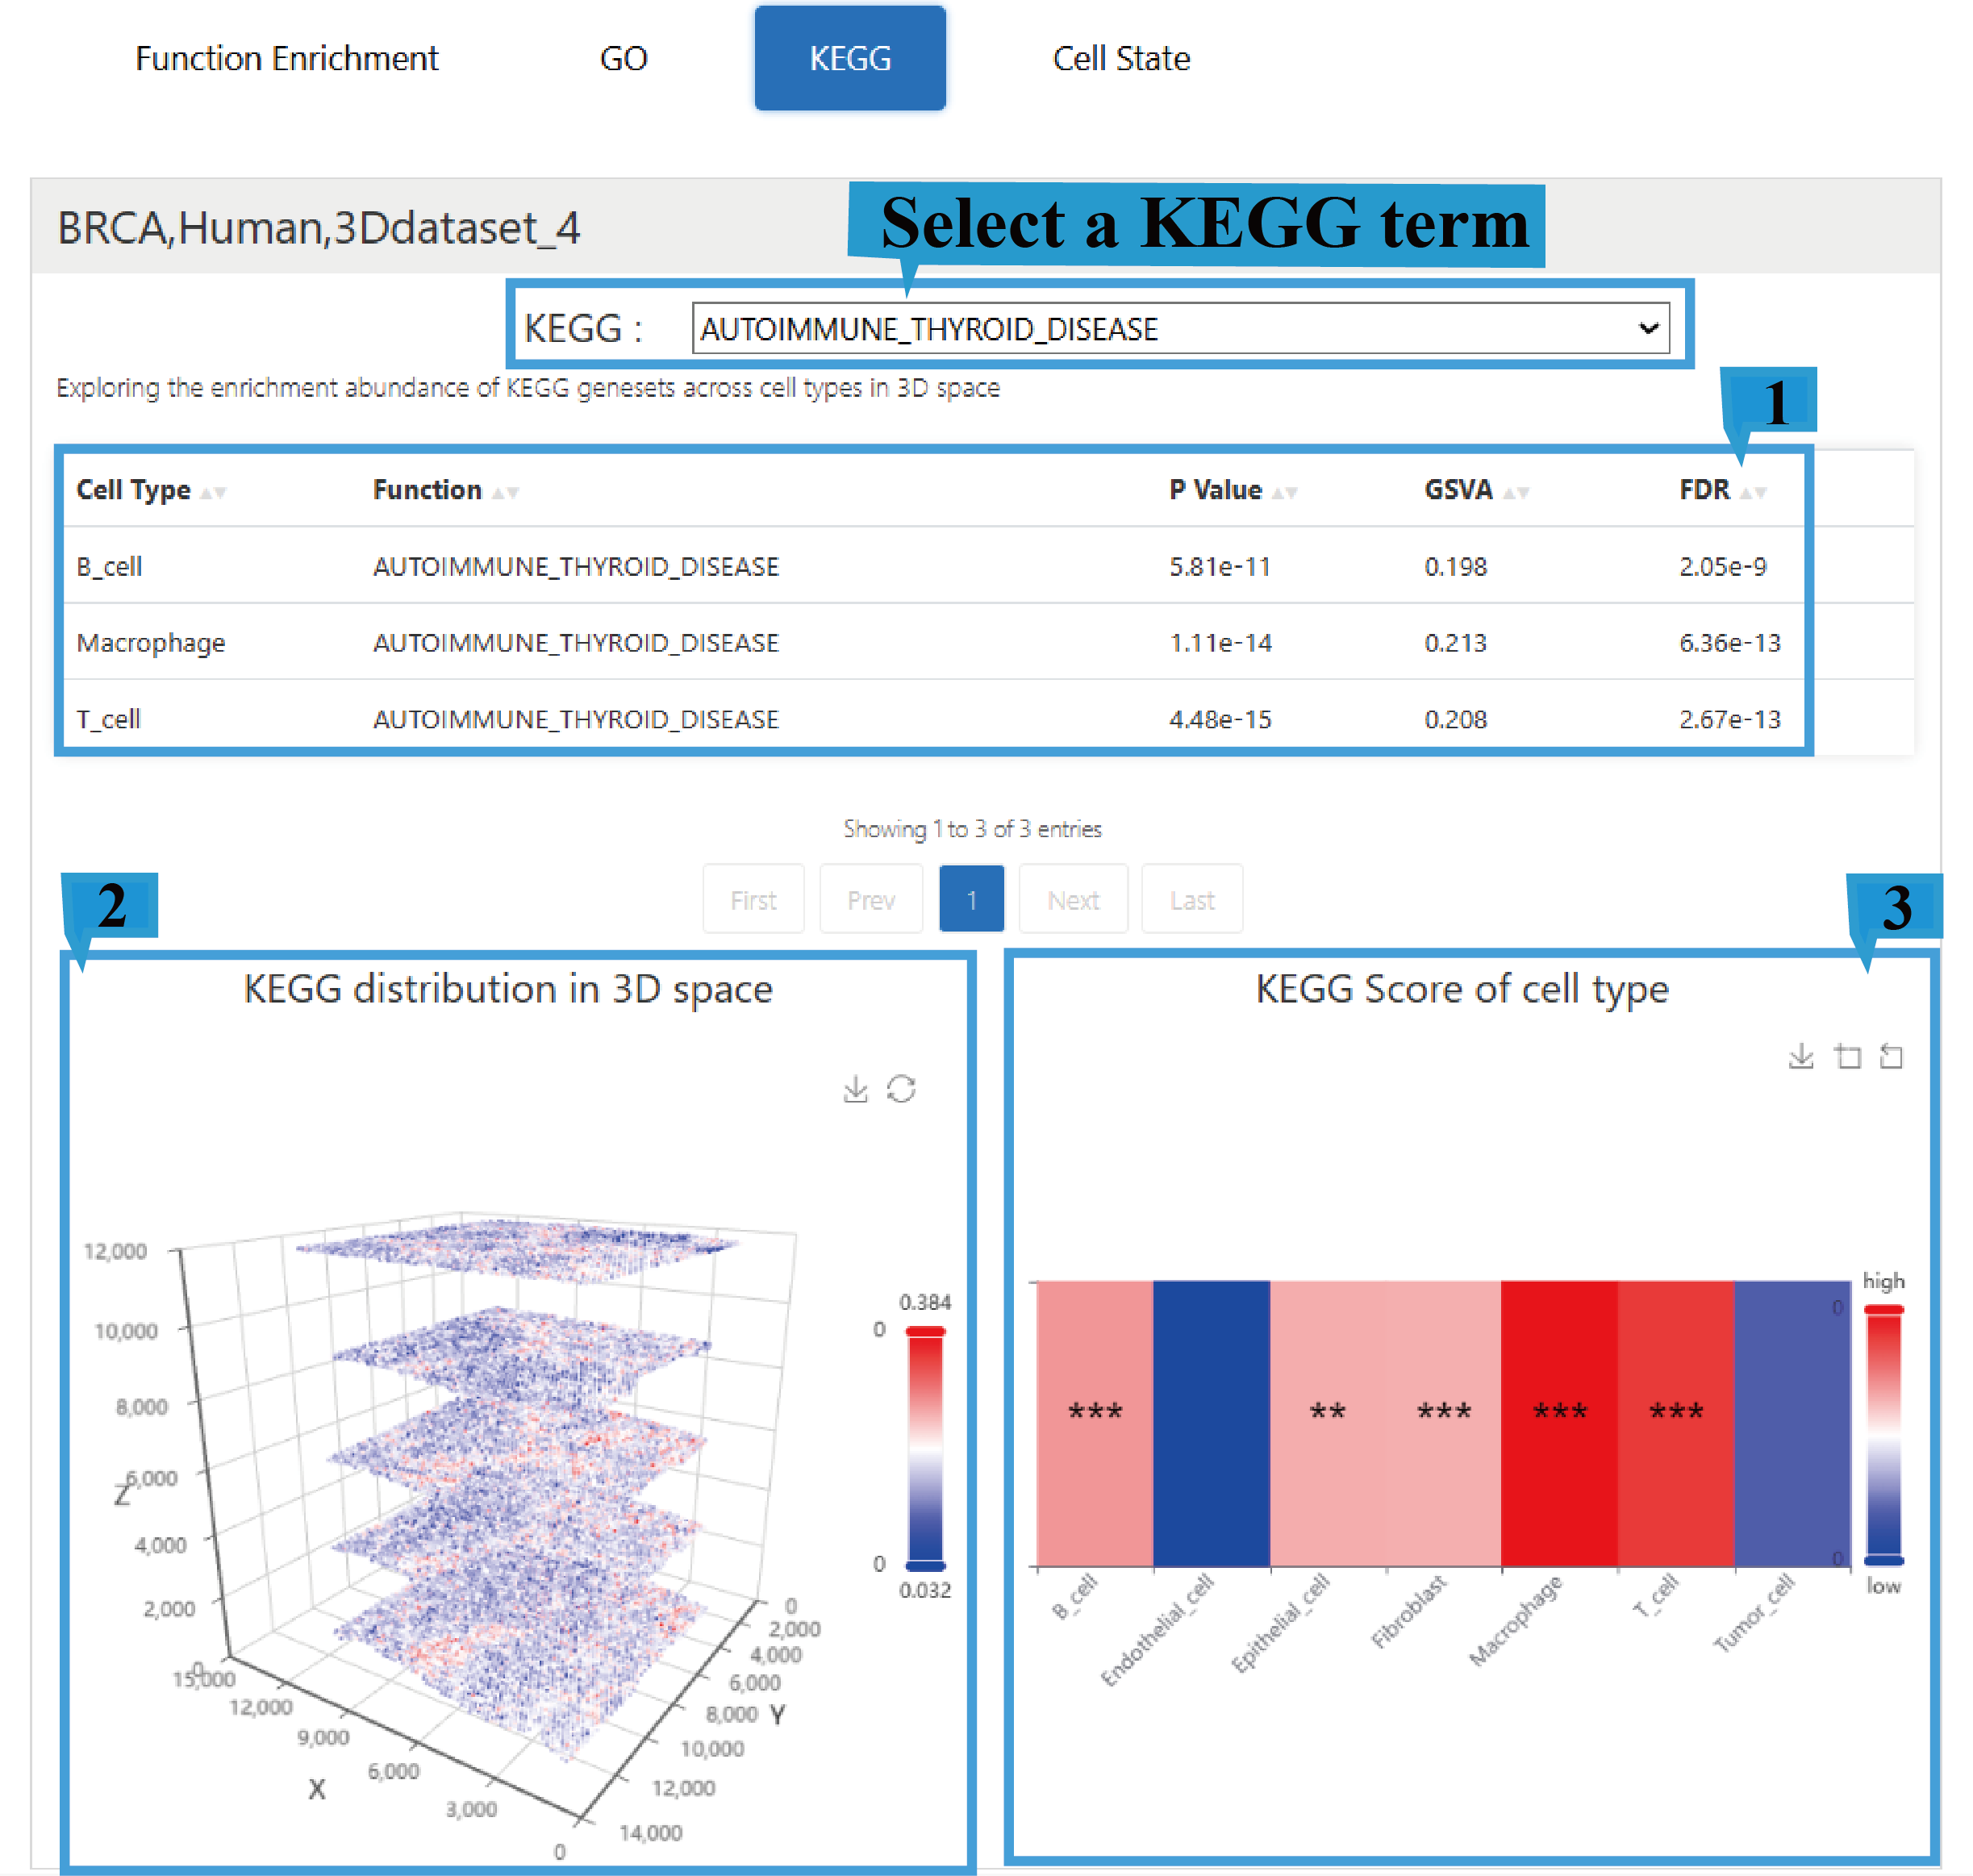
4)“KEGG” page:
1.The KEGG page presents a fundamental overview of the results, including enriched cell types, enriched functional categories (BP/CC/MF), P Value, the Gene Set Variation Analysis (GSVA) score, and the adjusted P-value (False Discovery Rate) ,Click the arrow next to the text to sort the list based on the content of that column; users can select different KEGG terms to view their corresponding functional enrichment profiles.
2.The graph shows the distribution of enriched KEGG terms in 3D space and allows users to rotate the view with the mouse for a better perspective.
3.The heatmap shows KEGG term scores across different cell types, with an asterisk (*) indicating the significance level of a KEGG term in a specific cell type.
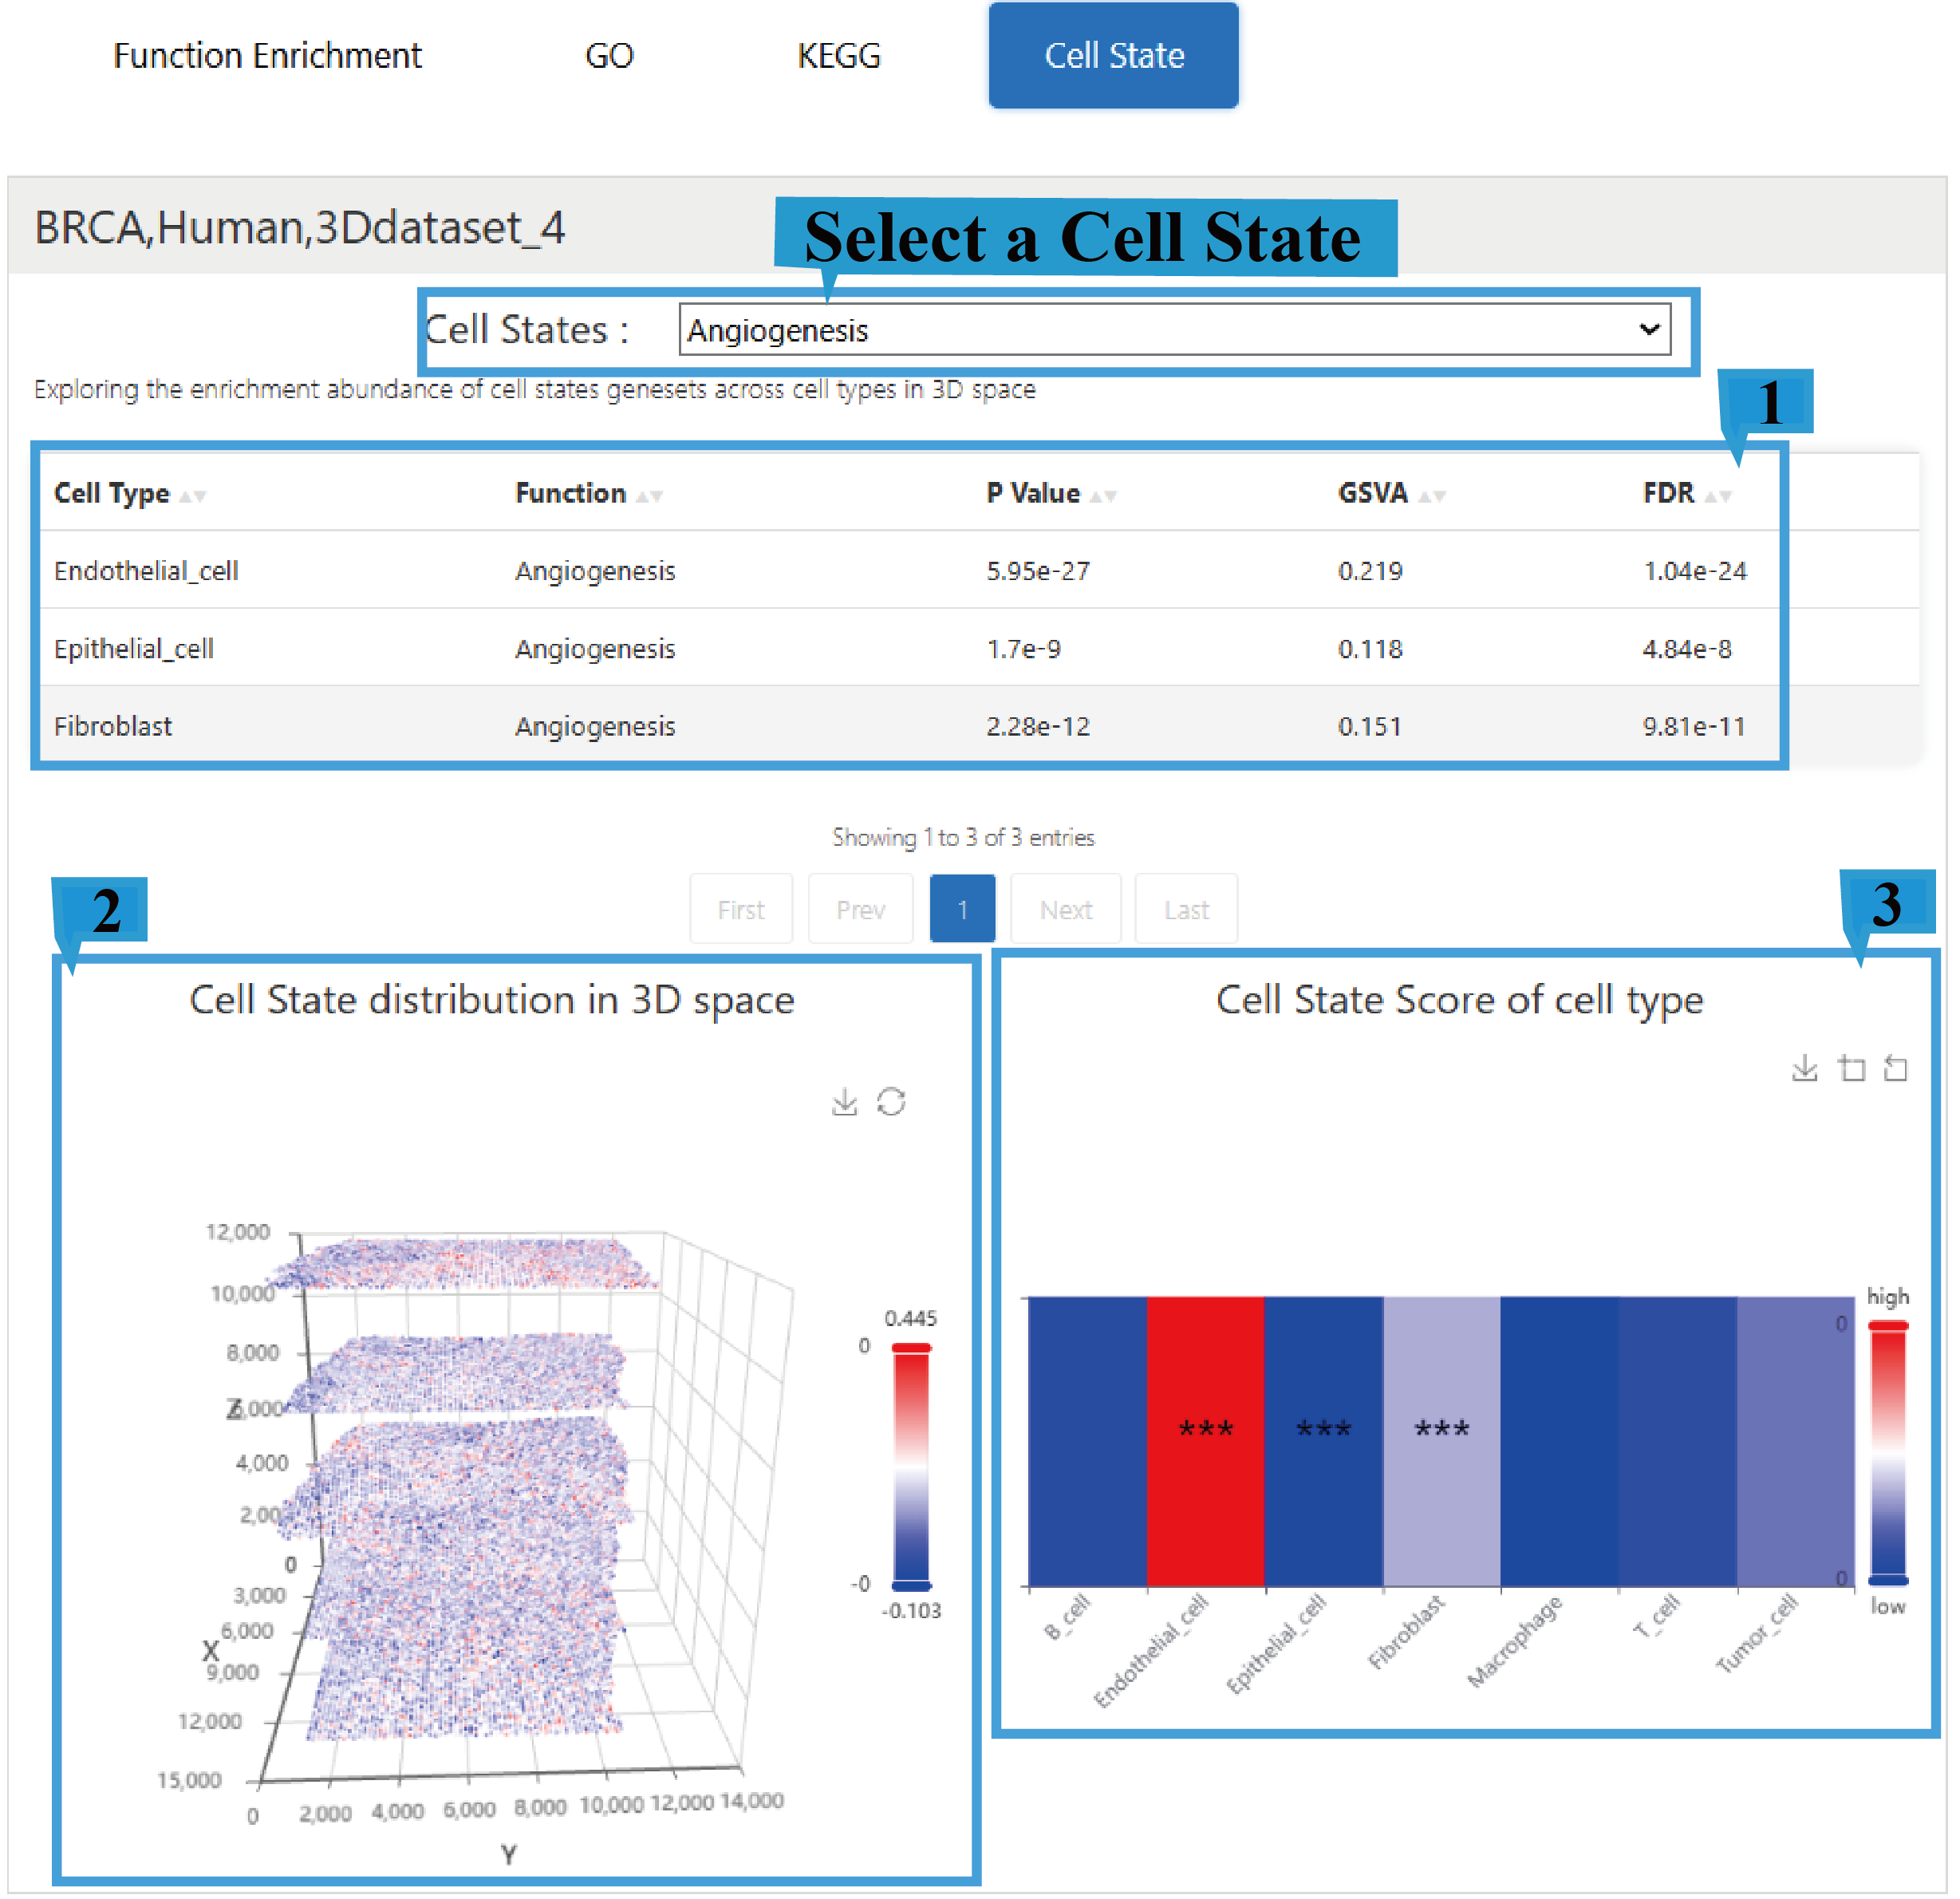
5)“Cell State” page:
1.The Cell State page presents a fundamental overview of the results, including enriched cell types, enriched functional categories (BP/CC/MF), P Value, the Gene Set Variation Analysis (GSVA) score, and the adjusted P-value (False Discovery Rate), Click the arrow next to the text to sort the list based on the content of that column; users can select different Cell State to view their corresponding functional enrichment profiles.
2.The graph shows the distribution of enriched Cell State terms in 3D space and allows users to rotate the view with the mouse for a better perspective.
3.The heatmap shows Cell State term scores across different cell types, with an asterisk (*) indicating the significance level of a Cell State term in a specific cell type.
Users can explore the interactions among these celltypes in 3D space.
1)Select dataset page:
1.This function provides an overview of 72 datasets, including Dataset ID, Species, Disease, Organ, Technology, Slice Number,Cell Type Number,Pathway Number and Marker Number, Click the arrow next to the text to sort the list based on the content of that column. To analyze cellular communication mechanisms, first select a dataset of interest and then select the required ligand-receptor pairs.
2.The Sankey diagram shows the overview of cell interactions in the dataset, with different colors representing different pathways.
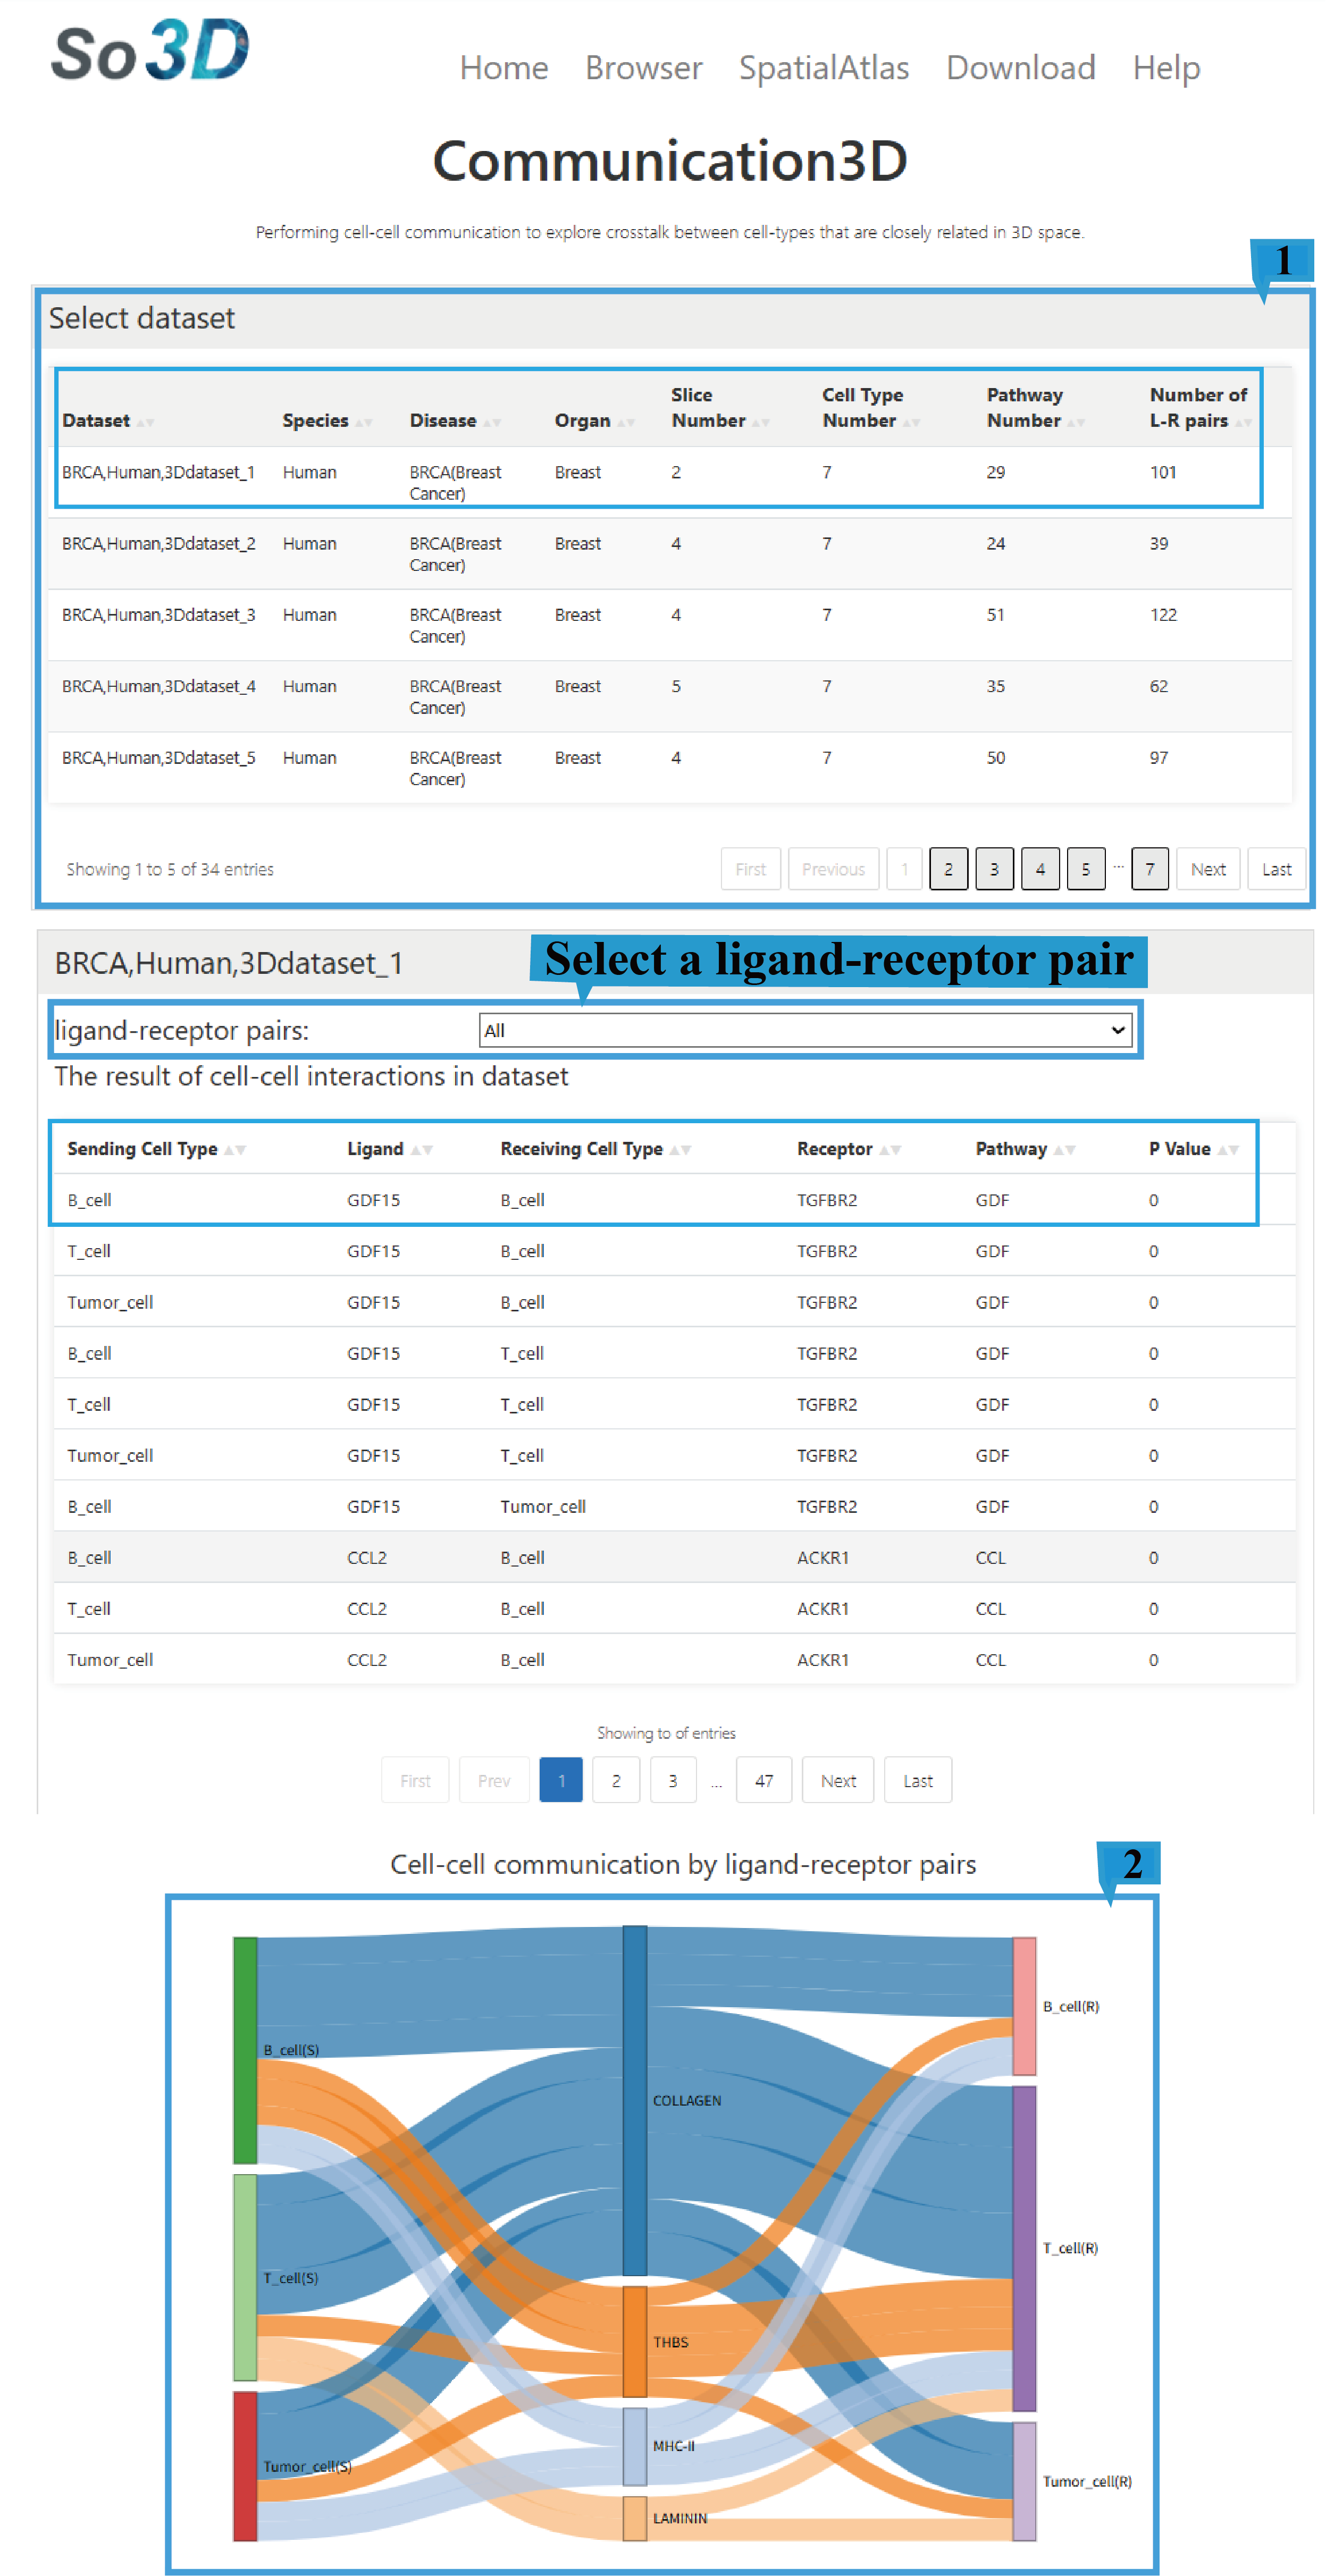
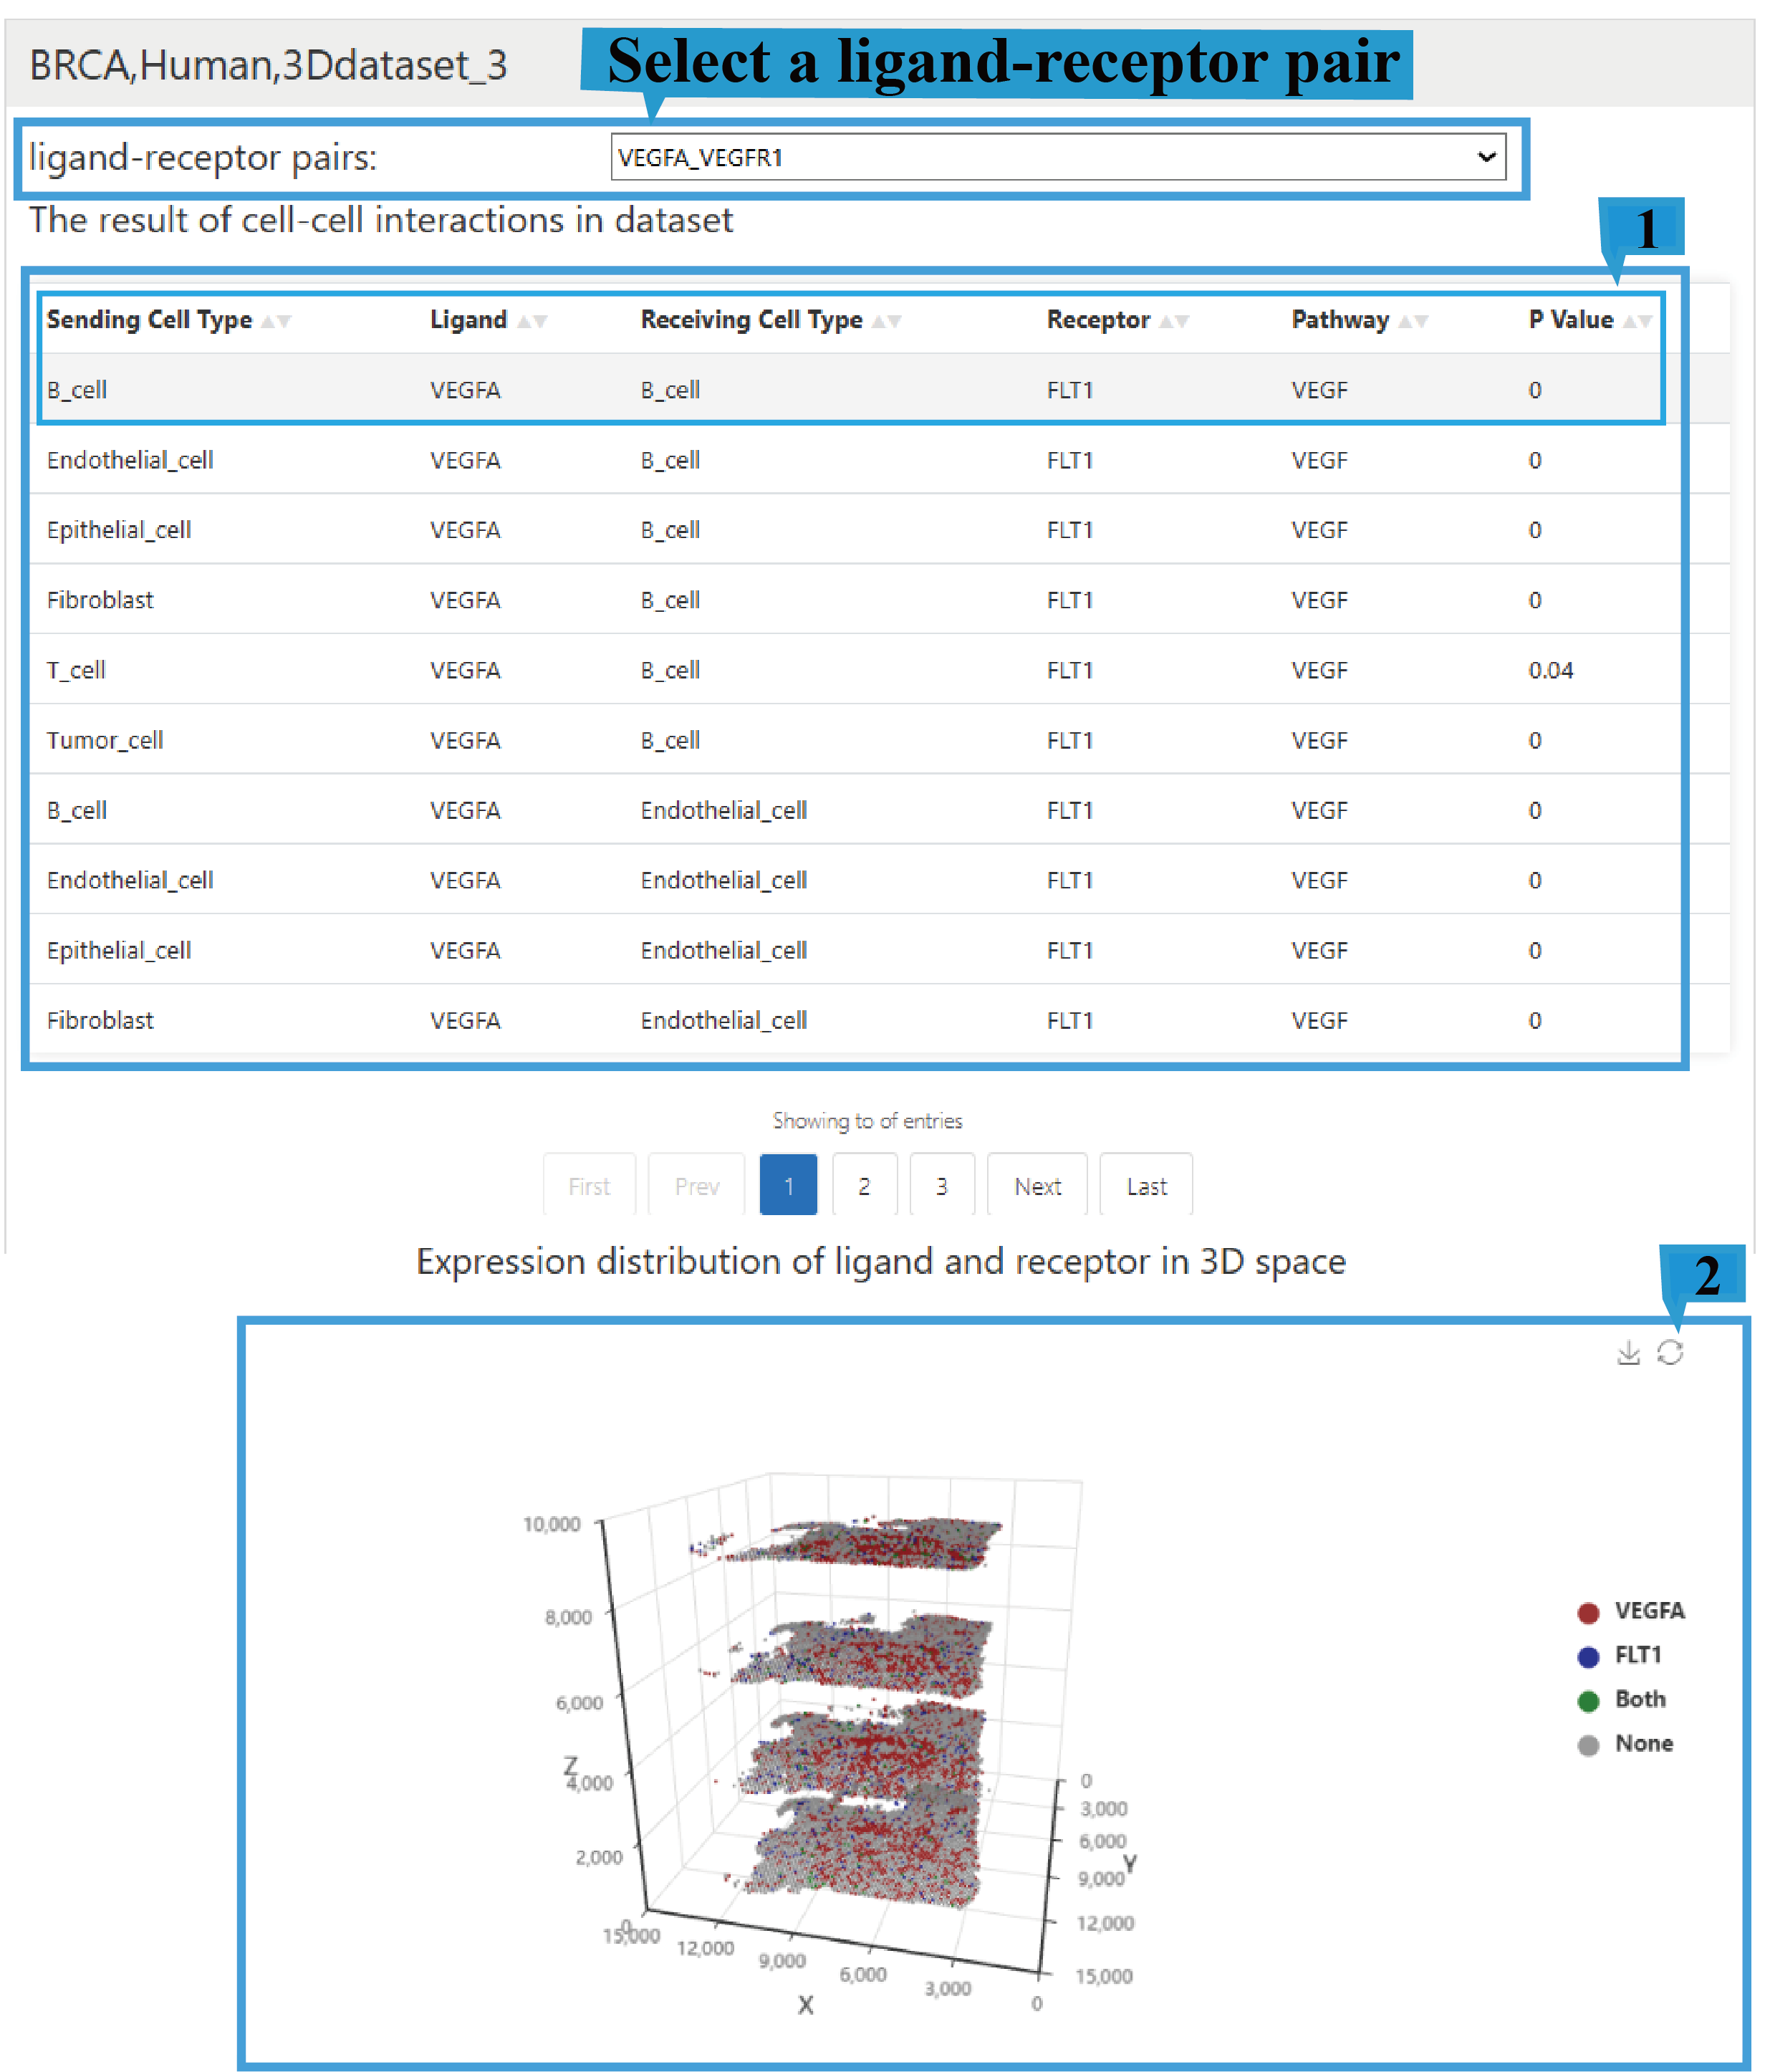
2) Search result table:
1.The ligand-receptor pairs interface provides a comprehensive overview for each entry, detailing sender cell type, ligand identity, receiver cell type, receptor identity, functional classification of the pair, and interaction score, Click the arrow next to the text to sort the list based on the content of that column. Users can explore underlying cell-cell communication patterns by selecting different ligand-receptor pairs.
2.This visualization depicts the spatial expression patterns of ligands and receptors within a three-dimensional coordinate system. Chromatically encoded data points represent their respective distribution profiles across the spatial domain. A dedicated color legend adjacent to the plot indicates expression status for both molecular species. Users can drag the mouse to rotate and view the distribution from different angles, and can also zoom in and out using the mouse wheel.
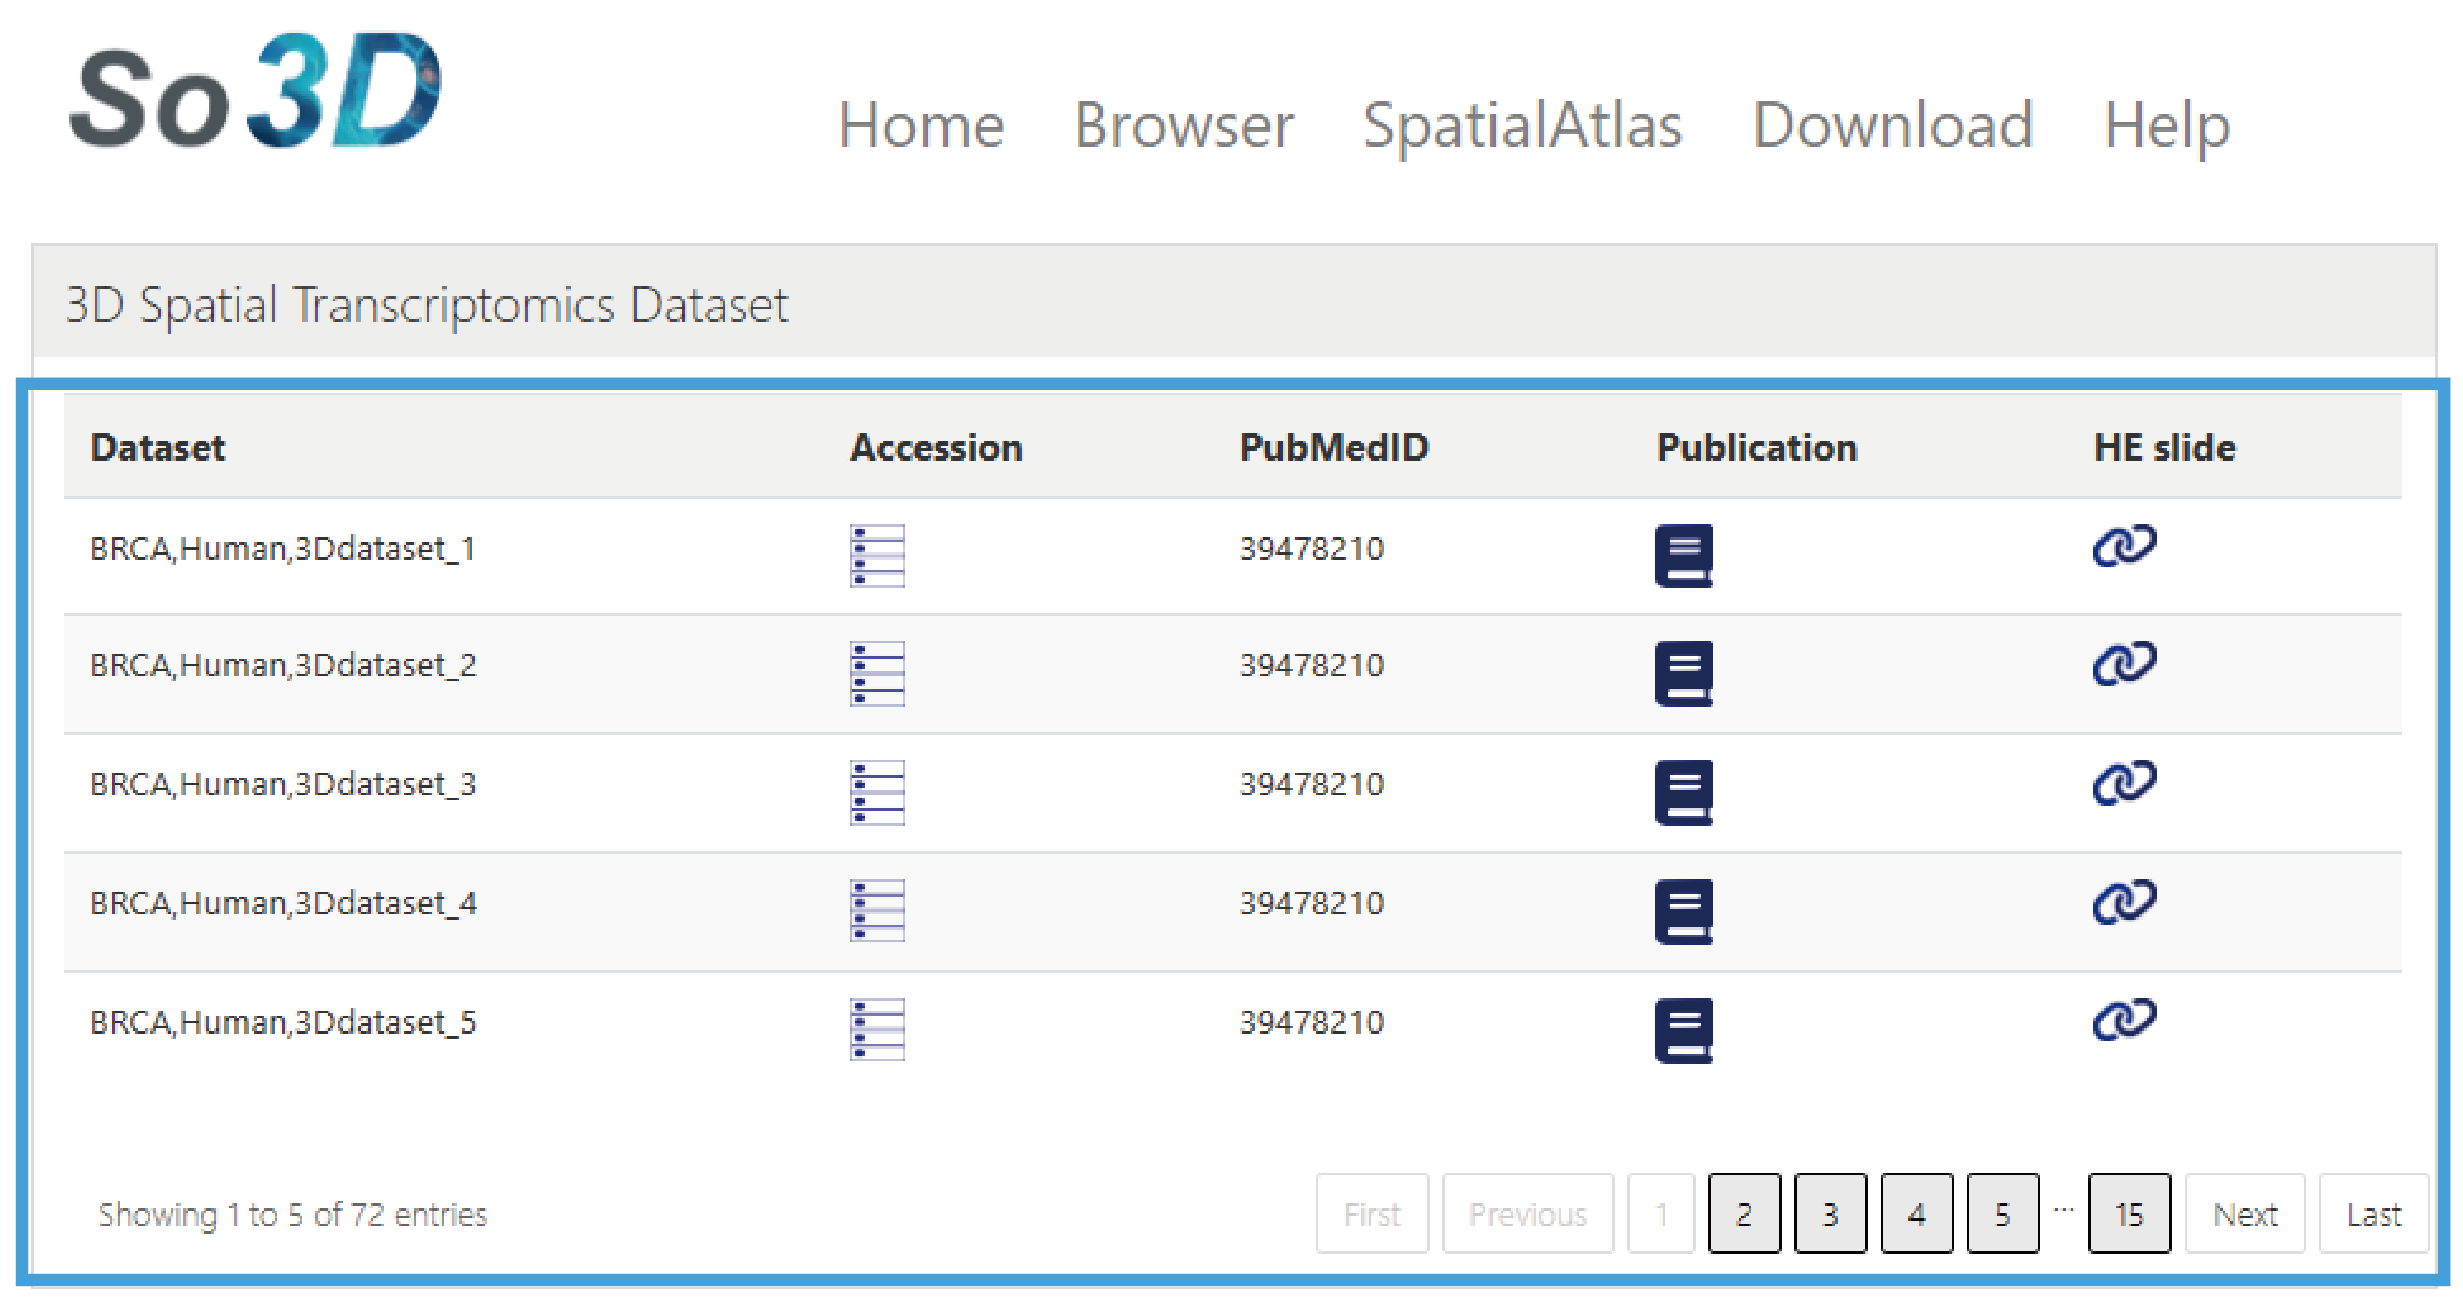
1.3D Spatial Transcriptomics Dataset
This section provides the download of 3d spatial transcriptome datasets, presented in a list format, including the Dataset ID, Data download links, PMID of related articles, Publication links, and Download links for HE slide.
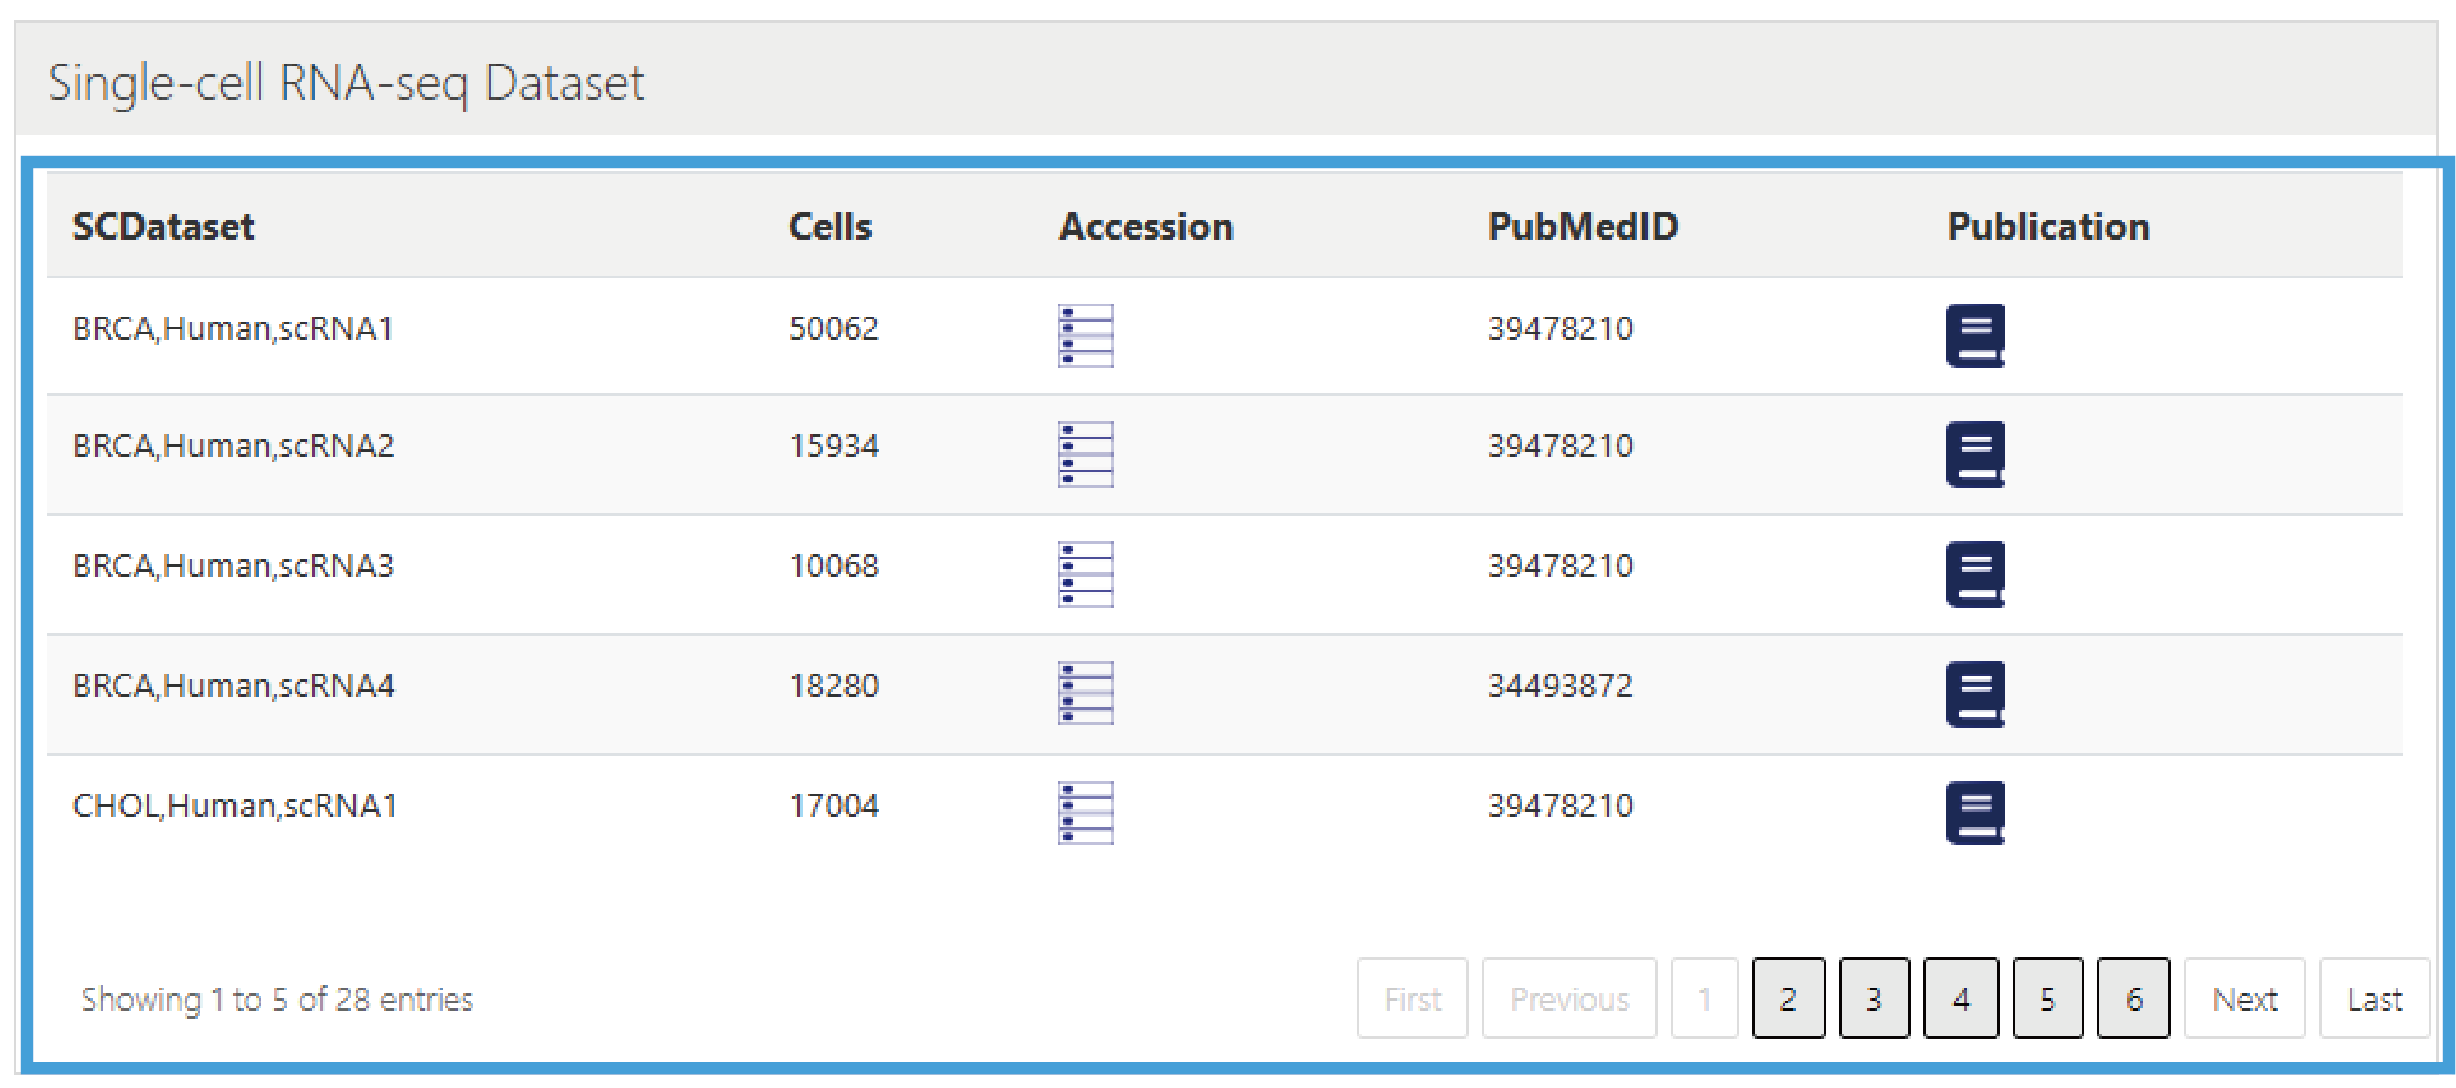
2.Single-cell RNA-seq Dataset
This section provides the download of single-cell datasets, presented in a list format, including Name of the single-cell dataset, Cell number , Data download links, PMID of related articles, and Publication links.
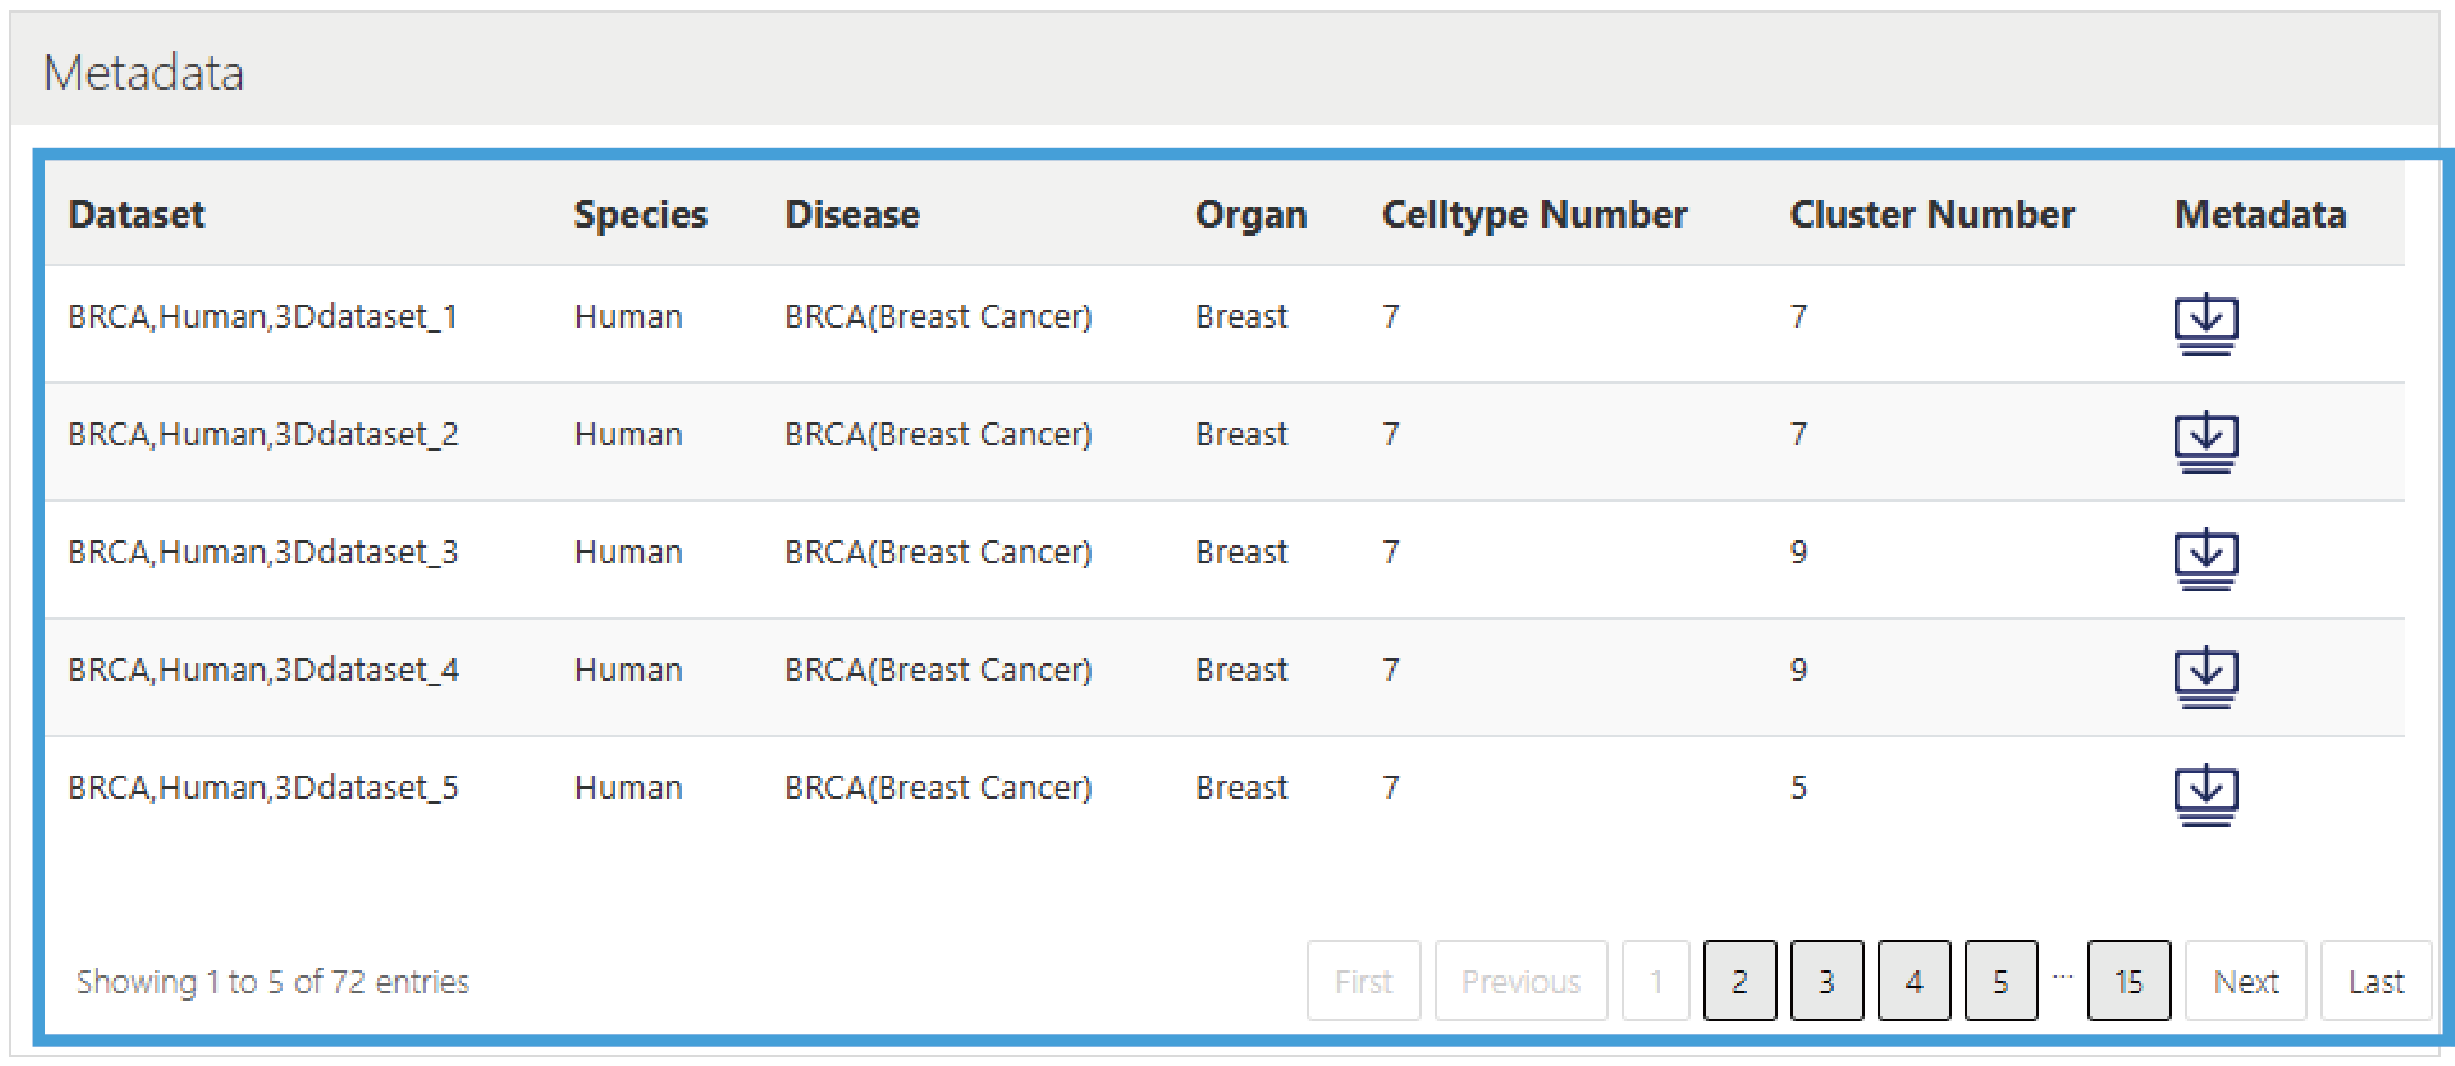
3.Metadata
This section provides the download of metadata, presented in a list format, including the Dataset ID, Species, Diseases, Organs, Cell type number, Cluster number, and Metadata download link.
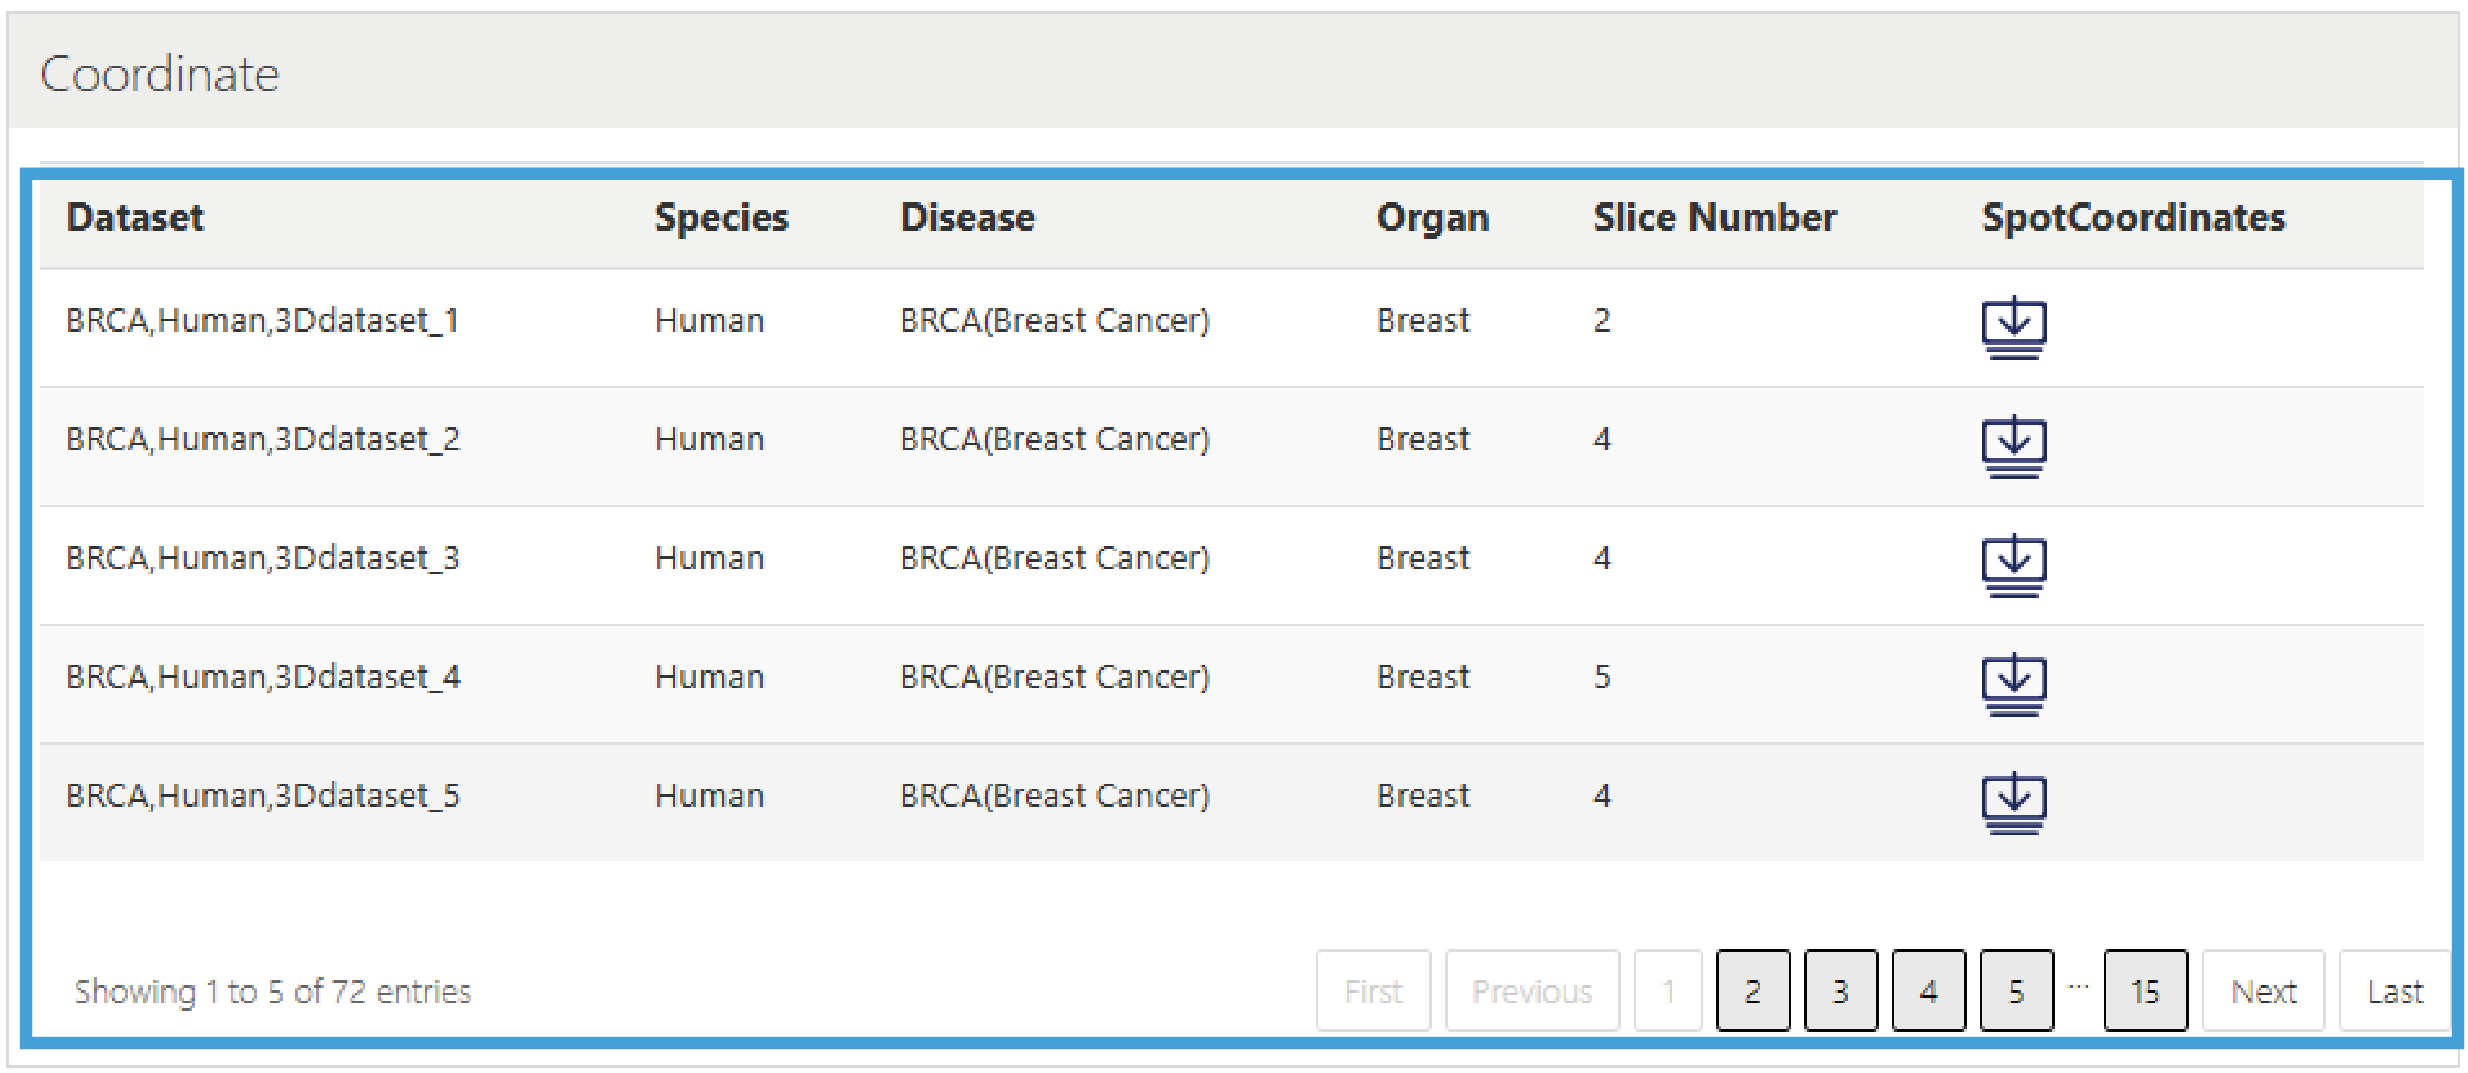
4.Coordinate
This section provides the download of 3d coordinates for spatial transcriptome datasets, presented in a list format, including the Dataset ID, Species, Disease, Organ, Slice number, and Download links for spot coordinates.
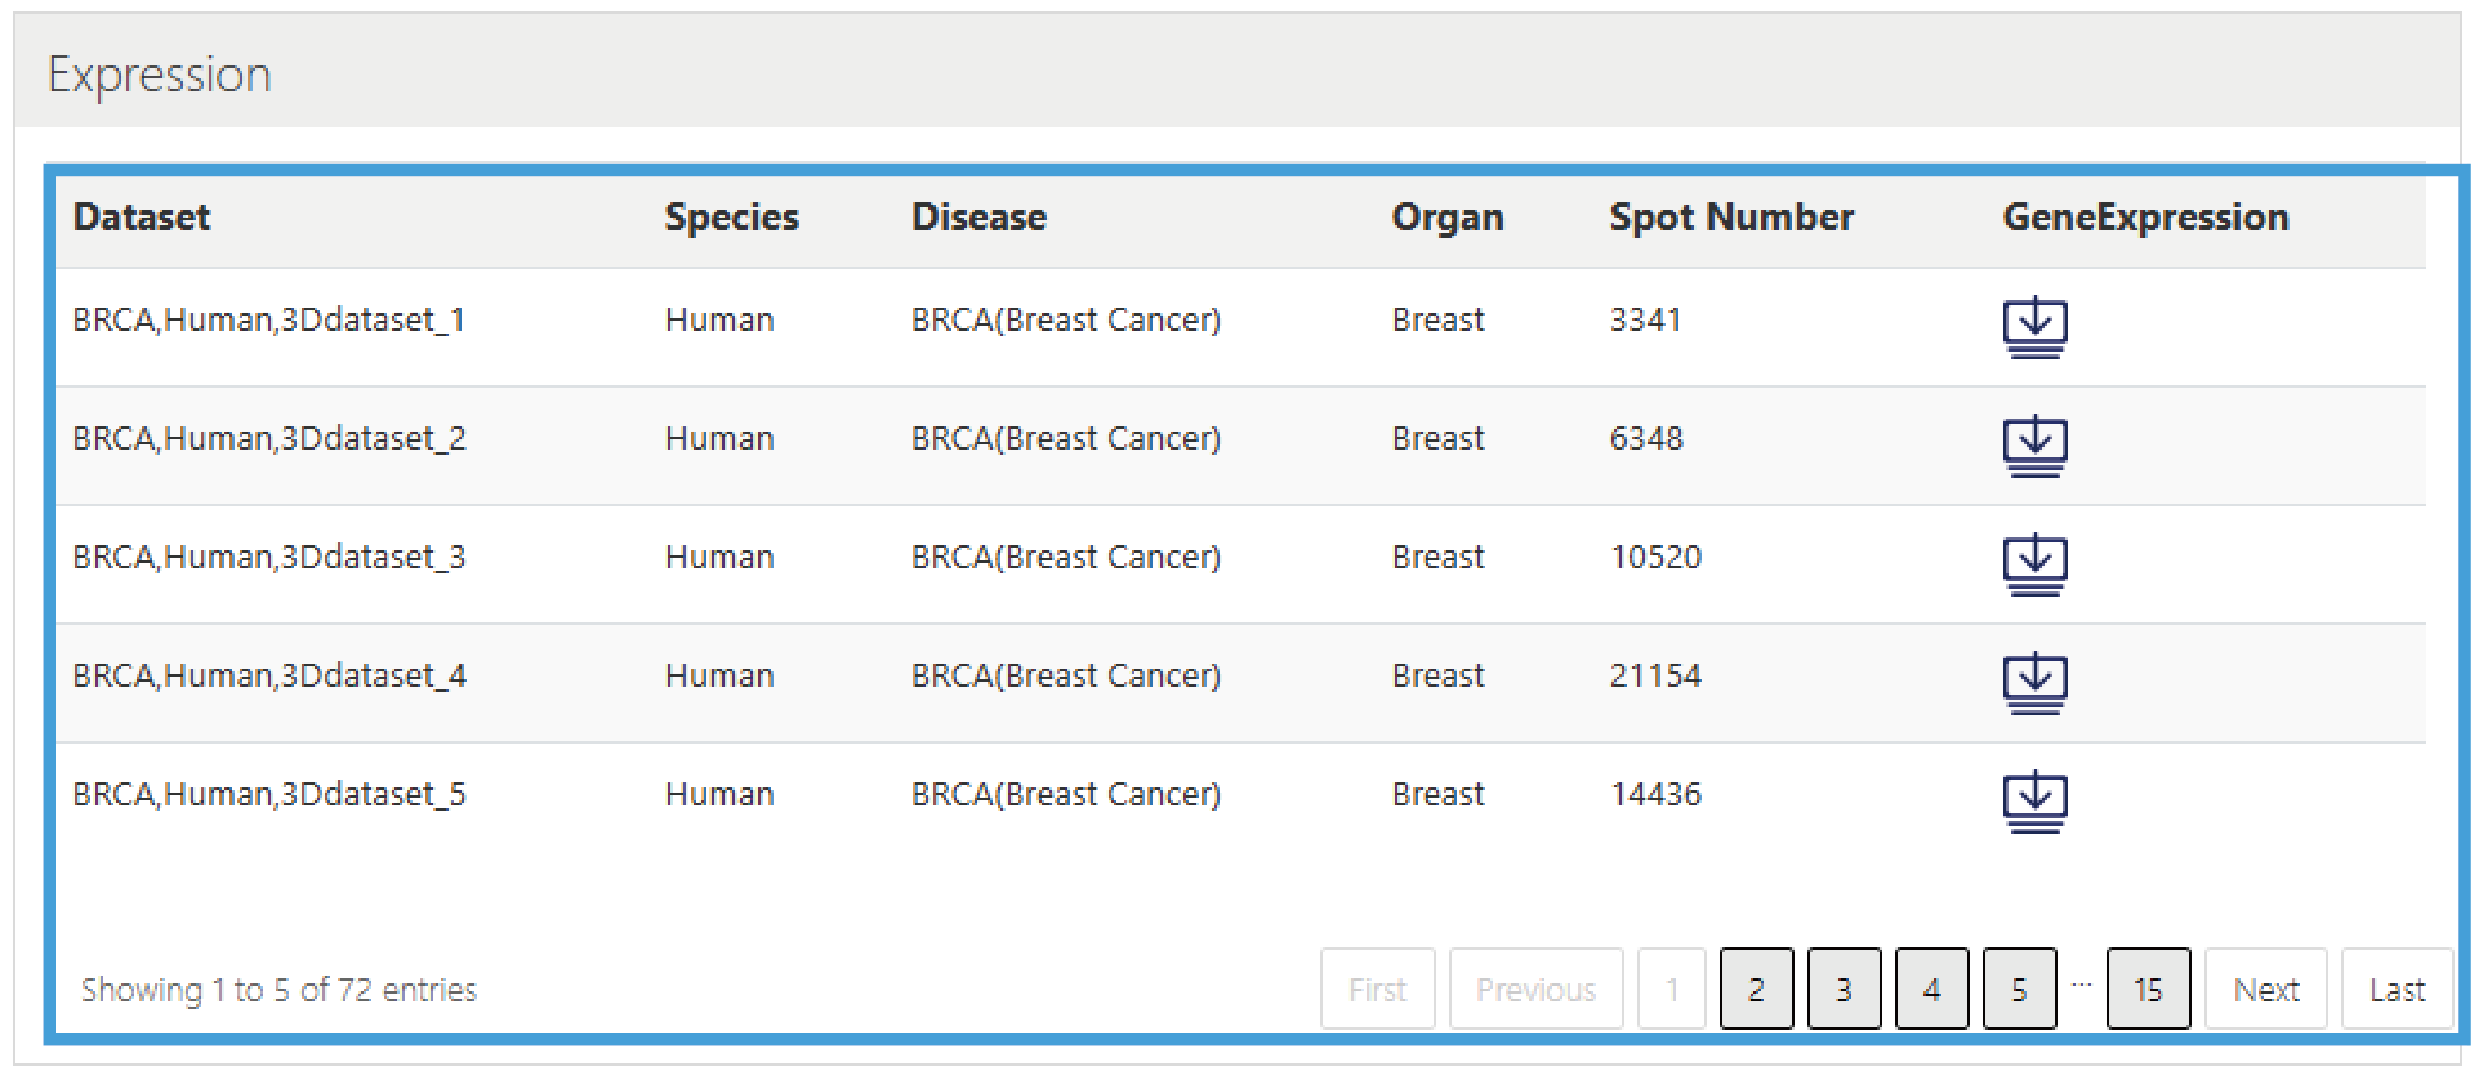
5.Expression
This section provides the download of gene expression data from spatial transcriptome datasets, presented in a list format, including Dataset ID, Species, Disease, Organ, Spot number, and Download link for gene expression data.